African vs Tlingit-Haida Unemployment Among Ages 20 to 24 years
COMPARE
African
Tlingit-Haida
Unemployment Among Ages 20 to 24 years
Unemployment Among Ages 20 to 24 years Comparison
Africans
Tlingit-Haida
11.5%
UNEMPLOYMENT AMONG AGES 20 TO 24 YEARS
0.0/ 100
METRIC RATING
277th/ 347
METRIC RANK
10.3%
UNEMPLOYMENT AMONG AGES 20 TO 24 YEARS
39.7/ 100
METRIC RATING
179th/ 347
METRIC RANK
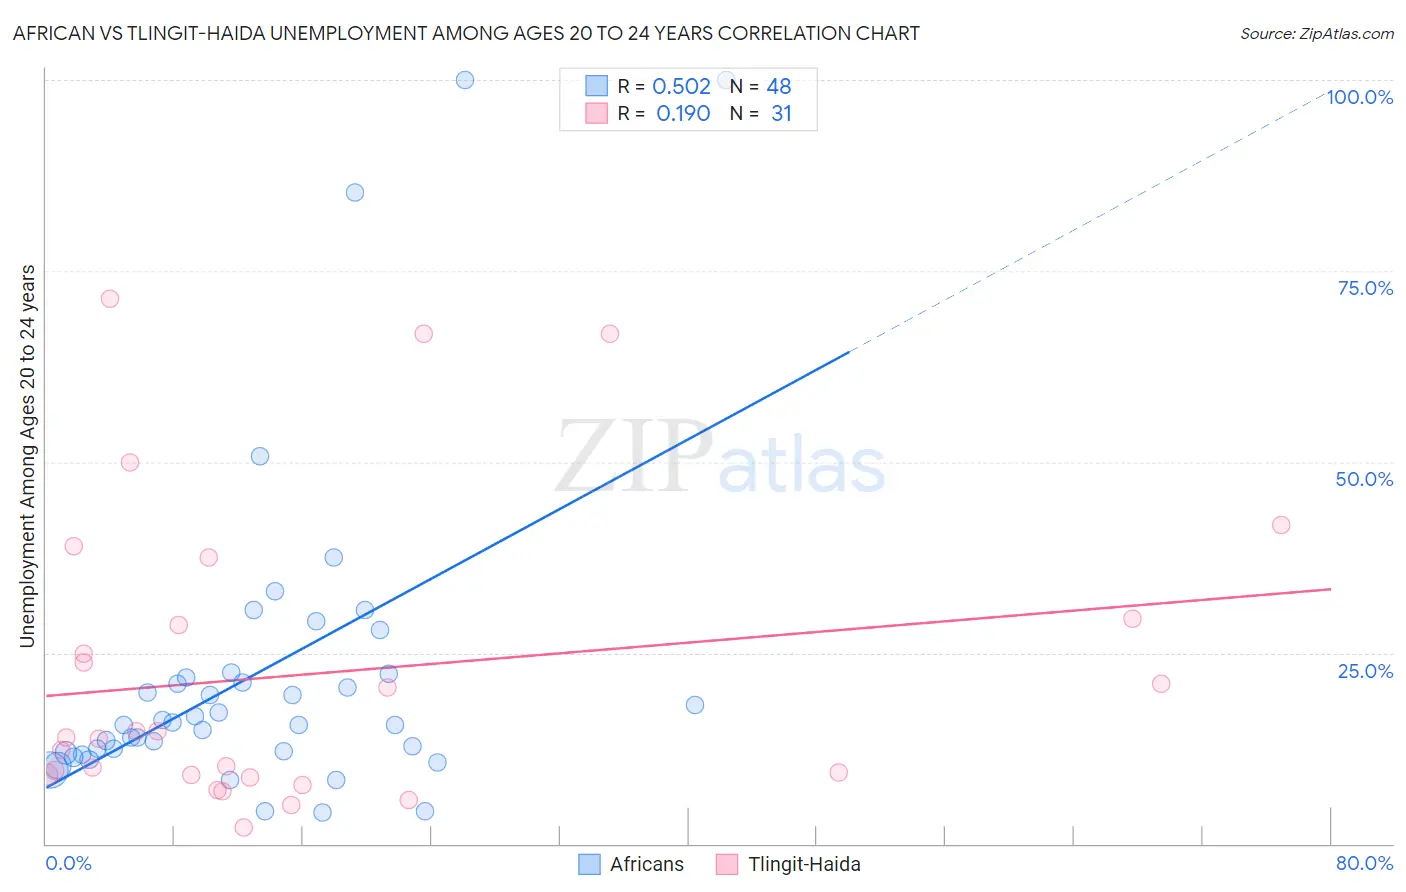
African vs Tlingit-Haida Unemployment Among Ages 20 to 24 years Correlation Chart
The statistical analysis conducted on geographies consisting of 452,548,100 people shows a substantial positive correlation between the proportion of Africans and unemployment rate among population between the ages 20 and 24 in the United States with a correlation coefficient (R) of 0.502 and weighted average of 11.5%. Similarly, the statistical analysis conducted on geographies consisting of 60,175,372 people shows a poor positive correlation between the proportion of Tlingit-Haida and unemployment rate among population between the ages 20 and 24 in the United States with a correlation coefficient (R) of 0.190 and weighted average of 10.3%, a difference of 11.6%.
Unemployment Among Ages 20 to 24 years Correlation Summary
| Measurement | African | Tlingit-Haida |
| Minimum | 4.0% | 2.2% |
| Maximum | 100.0% | 71.4% |
| Range | 96.0% | 69.2% |
| Mean | 22.3% | 22.3% |
| Median | 15.7% | 13.9% |
| Interquartile 25% (IQ1) | 12.0% | 9.0% |
| Interquartile 75% (IQ3) | 22.0% | 29.4% |
| Interquartile Range (IQR) | 10.0% | 20.4% |
| Standard Deviation (Sample) | 21.0% | 19.4% |
| Standard Deviation (Population) | 20.8% | 19.1% |
Similar Demographics by Unemployment Among Ages 20 to 24 years
Demographics Similar to Africans by Unemployment Among Ages 20 to 24 years
In terms of unemployment among ages 20 to 24 years, the demographic groups most similar to Africans are Colville (11.6%, a difference of 0.030%), Sierra Leonean (11.5%, a difference of 0.15%), Senegalese (11.5%, a difference of 0.19%), Bahamian (11.6%, a difference of 0.28%), and Cape Verdean (11.5%, a difference of 0.54%).
| Demographics | Rating | Rank | Unemployment Among Ages 20 to 24 years |
| Delaware | 0.0 /100 | #270 | Tragic 11.3% |
| Immigrants | Uzbekistan | 0.0 /100 | #271 | Tragic 11.4% |
| Nigerians | 0.0 /100 | #272 | Tragic 11.4% |
| Immigrants | Nigeria | 0.0 /100 | #273 | Tragic 11.5% |
| Cape Verdeans | 0.0 /100 | #274 | Tragic 11.5% |
| Senegalese | 0.0 /100 | #275 | Tragic 11.5% |
| Sierra Leoneans | 0.0 /100 | #276 | Tragic 11.5% |
| Africans | 0.0 /100 | #277 | Tragic 11.5% |
| Colville | 0.0 /100 | #278 | Tragic 11.6% |
| Bahamians | 0.0 /100 | #279 | Tragic 11.6% |
| Alaskan Athabascans | 0.0 /100 | #280 | Tragic 11.6% |
| Armenians | 0.0 /100 | #281 | Tragic 11.7% |
| Immigrants | Cameroon | 0.0 /100 | #282 | Tragic 11.7% |
| Ghanaians | 0.0 /100 | #283 | Tragic 11.7% |
| Immigrants | Western Africa | 0.0 /100 | #284 | Tragic 11.7% |
Demographics Similar to Tlingit-Haida by Unemployment Among Ages 20 to 24 years
In terms of unemployment among ages 20 to 24 years, the demographic groups most similar to Tlingit-Haida are Immigrants from Turkey (10.3%, a difference of 0.010%), Okinawan (10.3%, a difference of 0.020%), Alsatian (10.3%, a difference of 0.030%), Immigrants from Czechoslovakia (10.3%, a difference of 0.040%), and Immigrants from Germany (10.4%, a difference of 0.060%).
| Demographics | Rating | Rank | Unemployment Among Ages 20 to 24 years |
| Koreans | 51.9 /100 | #172 | Average 10.3% |
| Immigrants | Sweden | 50.8 /100 | #173 | Average 10.3% |
| Ukrainians | 50.0 /100 | #174 | Average 10.3% |
| Samoans | 45.4 /100 | #175 | Average 10.3% |
| Potawatomi | 42.0 /100 | #176 | Average 10.3% |
| Immigrants | Czechoslovakia | 40.8 /100 | #177 | Average 10.3% |
| Alsatians | 40.5 /100 | #178 | Average 10.3% |
| Tlingit-Haida | 39.7 /100 | #179 | Fair 10.3% |
| Immigrants | Turkey | 39.3 /100 | #180 | Fair 10.3% |
| Okinawans | 39.1 /100 | #181 | Fair 10.3% |
| Immigrants | Germany | 38.1 /100 | #182 | Fair 10.4% |
| Immigrants | Egypt | 37.4 /100 | #183 | Fair 10.4% |
| Greeks | 37.2 /100 | #184 | Fair 10.4% |
| Syrians | 35.6 /100 | #185 | Fair 10.4% |
| Guamanians/Chamorros | 35.4 /100 | #186 | Fair 10.4% |