Assyrian/Chaldean/Syriac vs Nicaraguan Male Unemployment

COMPARE

Assyrian/Chaldean/Syriac
Race
Ancestry
AfghanAfricanAlaska NativeAlaskan AthabascanAlbanianAleutAlsatianAmericanApacheArabArapahoArgentineanArmenianAssyrian/Chaldean/SyriacAustralianAustrianBahamianBangladeshiBarbadianBasqueBelgianBelizeanBermudanBhutaneseBlackfeetBolivianBrazilianBritishBritish West IndianBulgarianBurmeseCajunCambodianCanadianCape VerdeanCarpatho RusynCelticCentral AmericanCentral American IndianCherokeeCheyenneChickasawChileanChineseChippewaChoctawColombianColvilleComancheCosta RicanCreeCreekCroatianCrowCubanCypriotCzechCzechoslovakianDanishDelawareDominicanDutchDutch West IndianEastern EuropeanEcuadorianEgyptianEnglishEstonianEthiopianEuropeanFijianFilipinoFinnishFrenchFrench American IndianFrench CanadianGermanGerman RussianGhanaianGreekGuamanian/ChamorroGuatemalanGuyaneseHaitianHmongHonduranHopiHoumaHungarianIcelanderIndian (Asian)IndonesianInupiatIranianIraqiIrishIroquoisIsraeliItalianJamaicanJapaneseJordanianKenyanKiowaKoreanLaotianLatvianLebaneseLiberianLithuanianLumbeeLuxembourgerMacedonianMalaysianMalteseMarshalleseMenomineeMexicanMexican American IndianMongolianMoroccanNative HawaiianNavajoNepaleseNew ZealanderNigerianNorthern EuropeanNorwegianOkinawanOsageOttawaPaiutePakistaniPalestinianPanamanianParaguayanPennsylvania GermanPeruvianPimaPolishPortuguesePotawatomiPuebloPuerto RicanPuget Sound SalishRomanianRussianSalvadoranSamoanScandinavianScotch-IrishScottishSeminoleSenegaleseSerbianShoshoneSierra LeoneanSiouxSlavicSlovakSloveneSomaliSouth AfricanSouth AmericanSouth American IndianSoviet UnionSpaniardSpanishSpanish AmericanSpanish American IndianSri LankanSubsaharan AfricanSudaneseSwedishSwissSyrianTaiwaneseThaiTlingit-HaidaTohono O'OdhamTonganTrinidadian and TobagonianTsimshianTurkishU.S. Virgin IslanderUgandanUkrainianUruguayanUteVenezuelanVietnameseWelshWest IndianYakamaYaquiYugoslavianYumanYup'ikZimbabwean
Immigration
NonimmigrantsImmigrantsAfghanistanAfricaAlbaniaArgentinaArmeniaAsiaAustraliaAustriaBahamasBangladeshBarbadosBelarusBelgiumBelizeBoliviaBosnia and HerzegovinaBrazilBulgariaBurma/MyanmarCabo VerdeCambodiaCameroonCanadaCaribbeanCentral AmericaChileChinaColombiaCongoCosta RicaCroatiaCubaCzechoslovakiaDenmarkDominicaDominican RepublicEastern AfricaEastern AsiaEastern EuropeEcuadorEgyptEl SalvadorEnglandEritreaEthiopiaEuropeFijiFranceGermanyGhanaGreeceGrenadaGuatemalaGuyanaHaitiHondurasHong KongHungaryIndiaIndonesiaIranIraqIrelandIsraelItalyJamaicaJapanJordanKazakhstanKenyaKoreaKuwaitLaosLatin AmericaLatviaLebanonLiberiaLithuaniaMalaysiaMexicoMicronesiaMiddle AfricaMoldovaMoroccoNepalNetherlandsNicaraguaNigeriaNorth AmericaNorth MacedoniaNorthern AfricaNorthern EuropeNorwayOceaniaPakistanPanamaPeruPhilippinesPolandPortugalRomaniaRussiaSaudi ArabiaScotlandSenegalSerbiaSierra LeoneSingaporeSomaliaSouth AfricaSouth AmericaSouth Central AsiaSouth Eastern AsiaSouthern EuropeSpainSri LankaSt. Vincent and the GrenadinesSudanSwedenSwitzerlandSyriaTaiwanThailandTrinidad and TobagoTurkeyUgandaUkraineUruguayUzbekistanVenezuelaVietnamWest IndiesWestern AfricaWestern AsiaWestern EuropeYemenZaireZimbabweAzores
Nicaraguan
Race
Ancestry
AfghanAfricanAlaska NativeAlaskan AthabascanAlbanianAleutAlsatianAmericanApacheArabArapahoArgentineanArmenianAustralianAustrianBahamianBangladeshiBarbadianBasqueBelgianBelizeanBermudanBhutaneseBlackfeetBolivianBrazilianBritishBritish West IndianBulgarianBurmeseCajunCambodianCanadianCape VerdeanCarpatho RusynCelticCentral AmericanCentral American IndianCherokeeCheyenneChickasawChileanChineseChippewaChoctawColombianColvilleComancheCosta RicanCreeCreekCroatianCrowCubanCypriotCzechCzechoslovakianDanishDelawareDominicanDutchDutch West IndianEastern EuropeanEcuadorianEgyptianEnglishEstonianEthiopianEuropeanFijianFilipinoFinnishFrenchFrench American IndianFrench CanadianGermanGerman RussianGhanaianGreekGuamanian/ChamorroGuatemalanGuyaneseHaitianHmongHonduranHopiHoumaHungarianIcelanderIndian (Asian)IndonesianInupiatIranianIraqiIrishIroquoisIsraeliItalianJamaicanJapaneseJordanianKenyanKiowaKoreanLaotianLatvianLebaneseLiberianLithuanianLumbeeLuxembourgerMacedonianMalaysianMalteseMarshalleseMenomineeMexicanMexican American IndianMongolianMoroccanNative HawaiianNavajoNepaleseNew ZealanderNicaraguanNigerianNorthern EuropeanNorwegianOkinawanOsageOttawaPaiutePakistaniPalestinianPanamanianParaguayanPennsylvania GermanPeruvianPimaPolishPortuguesePotawatomiPuebloPuerto RicanPuget Sound SalishRomanianRussianSalvadoranSamoanScandinavianScotch-IrishScottishSeminoleSenegaleseSerbianShoshoneSierra LeoneanSiouxSlavicSlovakSloveneSomaliSouth AfricanSouth AmericanSouth American IndianSoviet UnionSpaniardSpanishSpanish AmericanSpanish American IndianSri LankanSubsaharan AfricanSudaneseSwedishSwissSyrianTaiwaneseThaiTlingit-HaidaTohono O'OdhamTonganTrinidadian and TobagonianTsimshianTurkishU.S. Virgin IslanderUgandanUkrainianUruguayanUteVenezuelanVietnameseWelshWest IndianYakamaYaquiYugoslavianYumanYup'ikZimbabwean
Immigration
NonimmigrantsImmigrantsAfghanistanAfricaAlbaniaArgentinaArmeniaAsiaAustraliaAustriaBahamasBangladeshBarbadosBelarusBelgiumBelizeBoliviaBosnia and HerzegovinaBrazilBulgariaBurma/MyanmarCabo VerdeCambodiaCameroonCanadaCaribbeanCentral AmericaChileChinaColombiaCongoCosta RicaCroatiaCubaCzechoslovakiaDenmarkDominicaDominican RepublicEastern AfricaEastern AsiaEastern EuropeEcuadorEgyptEl SalvadorEnglandEritreaEthiopiaEuropeFijiFranceGermanyGhanaGreeceGrenadaGuatemalaGuyanaHaitiHondurasHong KongHungaryIndiaIndonesiaIranIraqIrelandIsraelItalyJamaicaJapanJordanKazakhstanKenyaKoreaKuwaitLaosLatin AmericaLatviaLebanonLiberiaLithuaniaMalaysiaMexicoMicronesiaMiddle AfricaMoldovaMoroccoNepalNetherlandsNicaraguaNigeriaNorth AmericaNorth MacedoniaNorthern AfricaNorthern EuropeNorwayOceaniaPakistanPanamaPeruPhilippinesPolandPortugalRomaniaRussiaSaudi ArabiaScotlandSenegalSerbiaSierra LeoneSingaporeSomaliaSouth AfricaSouth AmericaSouth Central AsiaSouth Eastern AsiaSouthern EuropeSpainSri LankaSt. Vincent and the GrenadinesSudanSwedenSwitzerlandSyriaTaiwanThailandTrinidad and TobagoTurkeyUgandaUkraineUruguayUzbekistanVenezuelaVietnamWest IndiesWestern AfricaWestern AsiaWestern EuropeYemenZaireZimbabweAzores
Male Unemployment
Income
Poverty
Unemployment
Labor Participation
Family Structure
Vehicle Availability
Education Level
Disability

Male Unemployment Comparison

Assyrians/Chaldeans/Syriacs

Nicaraguans

Exceptional
Excellent
5.0%
MALE UNEMPLOYMENT
96.9/ 100
METRIC RATING
75th/ 347
METRIC RANK
5.1%
MALE UNEMPLOYMENT
88.2/ 100
METRIC RATING
122nd/ 347
METRIC RANK

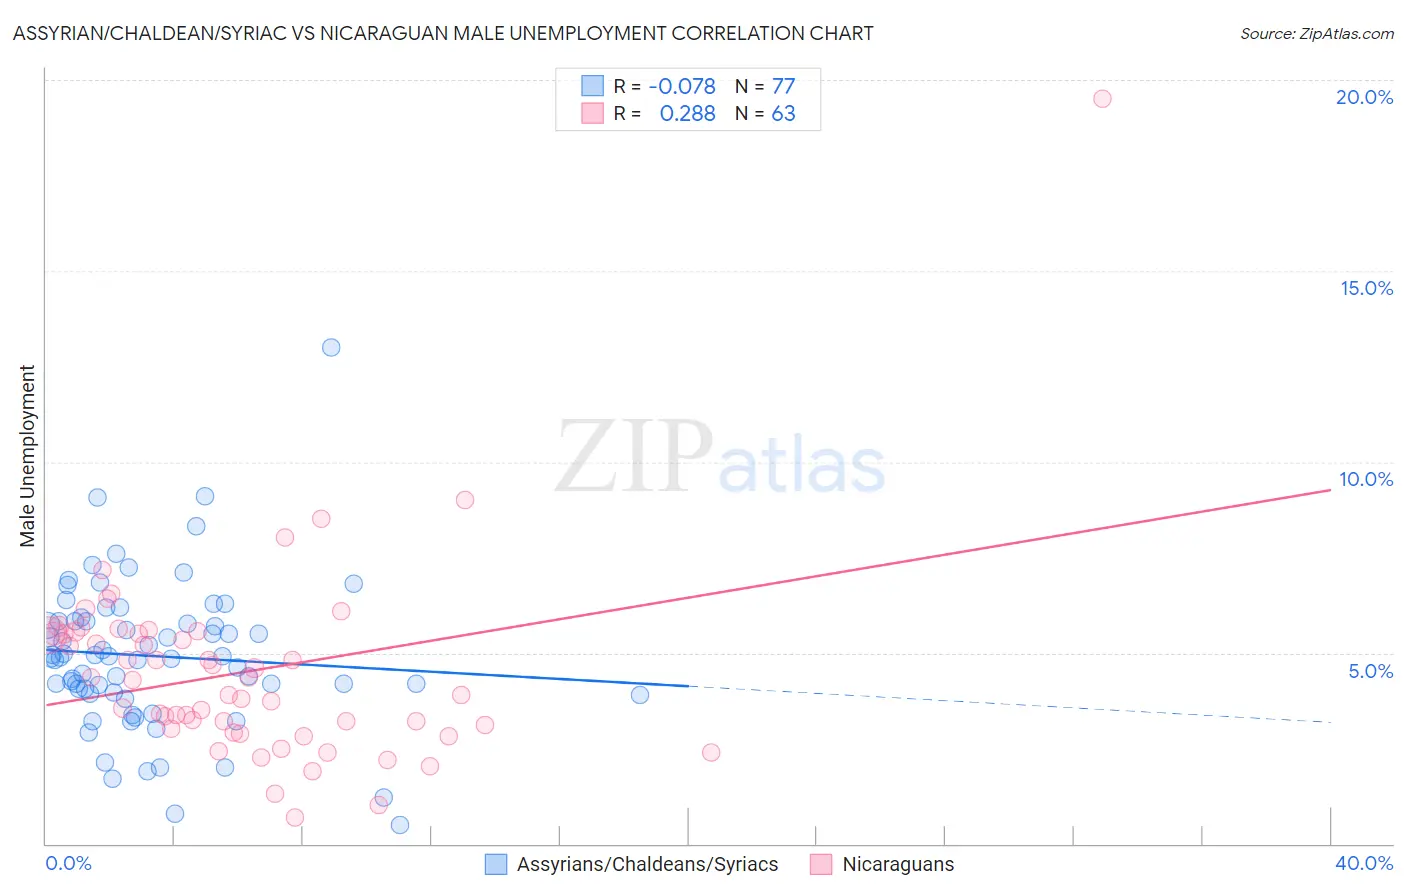
Assyrian/Chaldean/Syriac vs Nicaraguan Male Unemployment Correlation Chart

The statistical analysis conducted on geographies consisting of 110,205,366 people shows a slight negative correlation between the proportion of Assyrians/Chaldeans/Syriacs and unemployment rate among males in the United States with a correlation coefficient (R) of -0.078 and weighted average of 5.0%. Similarly, the statistical analysis conducted on geographies consisting of 285,177,185 people shows a weak positive correlation between the proportion of Nicaraguans and unemployment rate among males in the United States with a correlation coefficient (R) of 0.288 and weighted average of 5.1%, a difference of 2.2%.
Assyrian/Chaldean/Syriac vs Nicaraguan Male Unemployment

Male Unemployment Correlation Summary

MeasurementAssyrian/Chaldean/SyriacNicaraguan
Minimum0.50%0.70%
Maximum13.0%19.5%
Range12.5%18.8%
Mean4.9%4.5%
Median4.9%4.3%
Interquartile 25% (IQ1)3.9%3.0%
Interquartile 75% (IQ3)5.8%5.5%
Interquartile Range (IQR)1.9%2.5%
Standard Deviation (Sample)2.0%2.6%
Standard Deviation (Population)2.0%2.6%

Similar Demographics by Male Unemployment

Demographics Similar to Assyrians/Chaldeans/Syriacs by Male Unemployment

In terms of male unemployment, the demographic groups most similar to Assyrians/Chaldeans/Syriacs are Immigrants from North America (5.0%, a difference of 0.030%), Greek (5.0%, a difference of 0.060%), Immigrants from South Africa (5.0%, a difference of 0.14%), Immigrants from Sudan (5.0%, a difference of 0.16%), and Iranian (5.0%, a difference of 0.21%).
DemographicsRating | RankMale Unemployment
Australians
97.4
/100
|
#68
Exceptional
5.0%
Immigrants | Sweden
97.4
/100
|
#69
Exceptional
5.0%
Whites/Caucasians
97.3
/100
|
#70
Exceptional
5.0%
New Zealanders
97.3
/100
|
#71
Exceptional
5.0%
Immigrants | South Africa
97.1
/100
|
#72
Exceptional
5.0%
Greeks
97.0
/100
|
#73
Exceptional
5.0%
Immigrants | North America
96.9
/100
|
#74
Exceptional
5.0%
Assyrians/Chaldeans/Syriacs
96.9
/100
|
#75
Exceptional
5.0%
Immigrants | Sudan
96.5
/100
|
#76
Exceptional
5.0%
Iranians
96.4
/100
|
#77
Exceptional
5.0%
Immigrants | Northern Europe
96.4
/100
|
#78
Exceptional
5.0%
South Africans
96.4
/100
|
#79
Exceptional
5.0%
Argentineans
96.2
/100
|
#80
Exceptional
5.0%
French
96.2
/100
|
#81
Exceptional
5.0%
Chileans
96.2
/100
|
#82
Exceptional
5.0%

Demographics Similar to Nicaraguans by Male Unemployment

In terms of male unemployment, the demographic groups most similar to Nicaraguans are Mongolian (5.1%, a difference of 0.030%), Ukrainian (5.1%, a difference of 0.040%), French Canadian (5.1%, a difference of 0.060%), Palestinian (5.1%, a difference of 0.070%), and Cypriot (5.1%, a difference of 0.10%).
DemographicsRating | RankMale Unemployment
Immigrants | Asia
89.6
/100
|
#115
Excellent
5.1%
Immigrants | Denmark
89.4
/100
|
#116
Excellent
5.1%
Estonians
89.0
/100
|
#117
Excellent
5.1%
Cypriots
88.8
/100
|
#118
Excellent
5.1%
French Canadians
88.6
/100
|
#119
Excellent
5.1%
Ukrainians
88.4
/100
|
#120
Excellent
5.1%
Mongolians
88.4
/100
|
#121
Excellent
5.1%
Nicaraguans
88.2
/100
|
#122
Excellent
5.1%
Palestinians
87.7
/100
|
#123
Excellent
5.1%
Immigrants | Latvia
87.5
/100
|
#124
Excellent
5.1%
Immigrants | Lithuania
87.2
/100
|
#125
Excellent
5.1%
Immigrants | Colombia
86.8
/100
|
#126
Excellent
5.1%
Immigrants | Brazil
86.3
/100
|
#127
Excellent
5.2%
Hungarians
85.1
/100
|
#128
Excellent
5.2%
Immigrants | Western Europe
84.8
/100
|
#129
Excellent
5.2%