Assyrian/Chaldean/Syriac vs Iraqi Unemployment Among Ages 65 to 74 years
COMPARE
Assyrian/Chaldean/Syriac
Iraqi
Unemployment Among Ages 65 to 74 years
Unemployment Among Ages 65 to 74 years Comparison
Assyrians/Chaldeans/Syriacs
Iraqis
5.1%
UNEMPLOYMENT AMONG AGES 65 TO 74 YEARS
99.9/ 100
METRIC RATING
43rd/ 347
METRIC RANK
4.9%
UNEMPLOYMENT AMONG AGES 65 TO 74 YEARS
100.0/ 100
METRIC RATING
24th/ 347
METRIC RANK
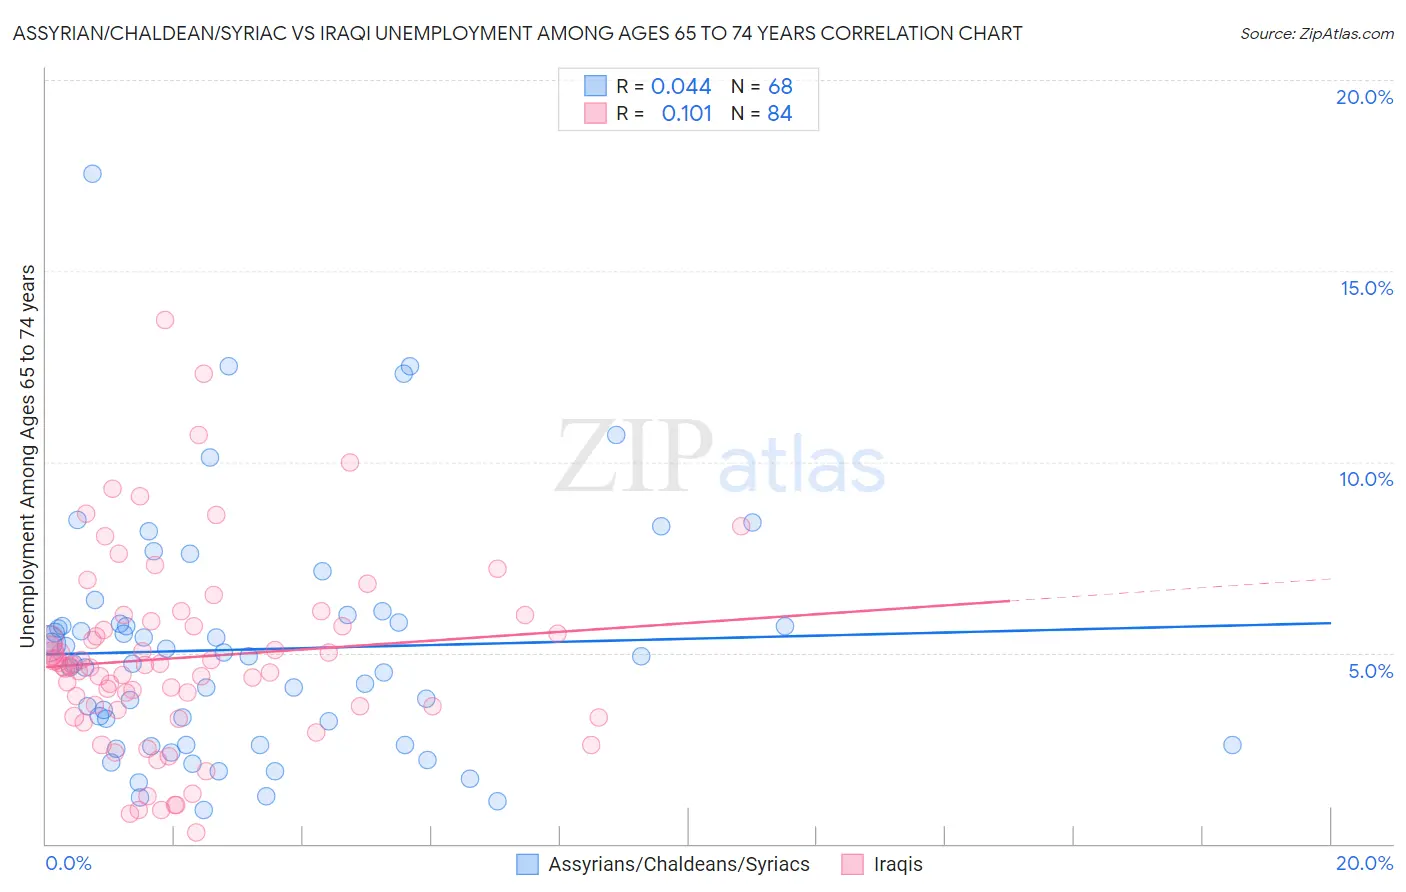
Assyrian/Chaldean/Syriac vs Iraqi Unemployment Among Ages 65 to 74 years Correlation Chart
The statistical analysis conducted on geographies consisting of 106,069,600 people shows no correlation between the proportion of Assyrians/Chaldeans/Syriacs and unemployment rate among population between the ages 65 and 74 in the United States with a correlation coefficient (R) of 0.044 and weighted average of 5.1%. Similarly, the statistical analysis conducted on geographies consisting of 161,611,682 people shows a poor positive correlation between the proportion of Iraqis and unemployment rate among population between the ages 65 and 74 in the United States with a correlation coefficient (R) of 0.101 and weighted average of 4.9%, a difference of 2.9%.
Unemployment Among Ages 65 to 74 years Correlation Summary
| Measurement | Assyrian/Chaldean/Syriac | Iraqi |
| Minimum | 0.90% | 0.30% |
| Maximum | 17.5% | 13.7% |
| Range | 16.6% | 13.4% |
| Mean | 5.1% | 4.9% |
| Median | 4.8% | 4.7% |
| Interquartile 25% (IQ1) | 2.6% | 3.6% |
| Interquartile 75% (IQ3) | 5.8% | 5.8% |
| Interquartile Range (IQR) | 3.2% | 2.2% |
| Standard Deviation (Sample) | 3.1% | 2.5% |
| Standard Deviation (Population) | 3.1% | 2.5% |
Demographics Similar to Assyrians/Chaldeans/Syriacs and Iraqis by Unemployment Among Ages 65 to 74 years
In terms of unemployment among ages 65 to 74 years, the demographic groups most similar to Assyrians/Chaldeans/Syriacs are Jordanian (5.1%, a difference of 0.12%), Ugandan (5.1%, a difference of 0.27%), Immigrants from Iraq (5.1%, a difference of 0.28%), Immigrants from Sweden (5.0%, a difference of 0.45%), and Nepalese (5.0%, a difference of 0.47%). Similarly, the demographic groups most similar to Iraqis are Immigrants from Nepal (4.9%, a difference of 0.21%), Macedonian (5.0%, a difference of 0.56%), Czech (5.0%, a difference of 0.61%), Norwegian (5.0%, a difference of 0.80%), and Bulgarian (5.0%, a difference of 0.90%).
| Demographics | Rating | Rank | Unemployment Among Ages 65 to 74 years |
| Immigrants | Nepal | 100.0 /100 | #23 | Exceptional 4.9% |
| Iraqis | 100.0 /100 | #24 | Exceptional 4.9% |
| Macedonians | 100.0 /100 | #25 | Exceptional 5.0% |
| Czechs | 100.0 /100 | #26 | Exceptional 5.0% |
| Norwegians | 100.0 /100 | #27 | Exceptional 5.0% |
| Bulgarians | 100.0 /100 | #28 | Exceptional 5.0% |
| Ethiopians | 100.0 /100 | #29 | Exceptional 5.0% |
| Immigrants | Lebanon | 100.0 /100 | #30 | Exceptional 5.0% |
| Slovenes | 100.0 /100 | #31 | Exceptional 5.0% |
| Palestinians | 100.0 /100 | #32 | Exceptional 5.0% |
| Belgians | 100.0 /100 | #33 | Exceptional 5.0% |
| Cambodians | 100.0 /100 | #34 | Exceptional 5.0% |
| Bhutanese | 100.0 /100 | #35 | Exceptional 5.0% |
| Immigrants | Kuwait | 99.9 /100 | #36 | Exceptional 5.0% |
| Immigrants | Eastern Africa | 99.9 /100 | #37 | Exceptional 5.0% |
| Nepalese | 99.9 /100 | #38 | Exceptional 5.0% |
| Immigrants | Sweden | 99.9 /100 | #39 | Exceptional 5.0% |
| Immigrants | Iraq | 99.9 /100 | #40 | Exceptional 5.1% |
| Ugandans | 99.9 /100 | #41 | Exceptional 5.1% |
| Jordanians | 99.9 /100 | #42 | Exceptional 5.1% |
| Assyrians/Chaldeans/Syriacs | 99.9 /100 | #43 | Exceptional 5.1% |