Assyrian/Chaldean/Syriac vs Black/African American Unemployment Among Ages 45 to 54 years
COMPARE
Assyrian/Chaldean/Syriac
Black/African American
Unemployment Among Ages 45 to 54 years
Unemployment Among Ages 45 to 54 years Comparison
Assyrians/Chaldeans/Syriacs
Blacks/African Americans
4.7%
UNEMPLOYMENT AMONG AGES 45 TO 54 YEARS
3.5/ 100
METRIC RATING
226th/ 347
METRIC RANK
5.4%
UNEMPLOYMENT AMONG AGES 45 TO 54 YEARS
0.0/ 100
METRIC RATING
308th/ 347
METRIC RANK
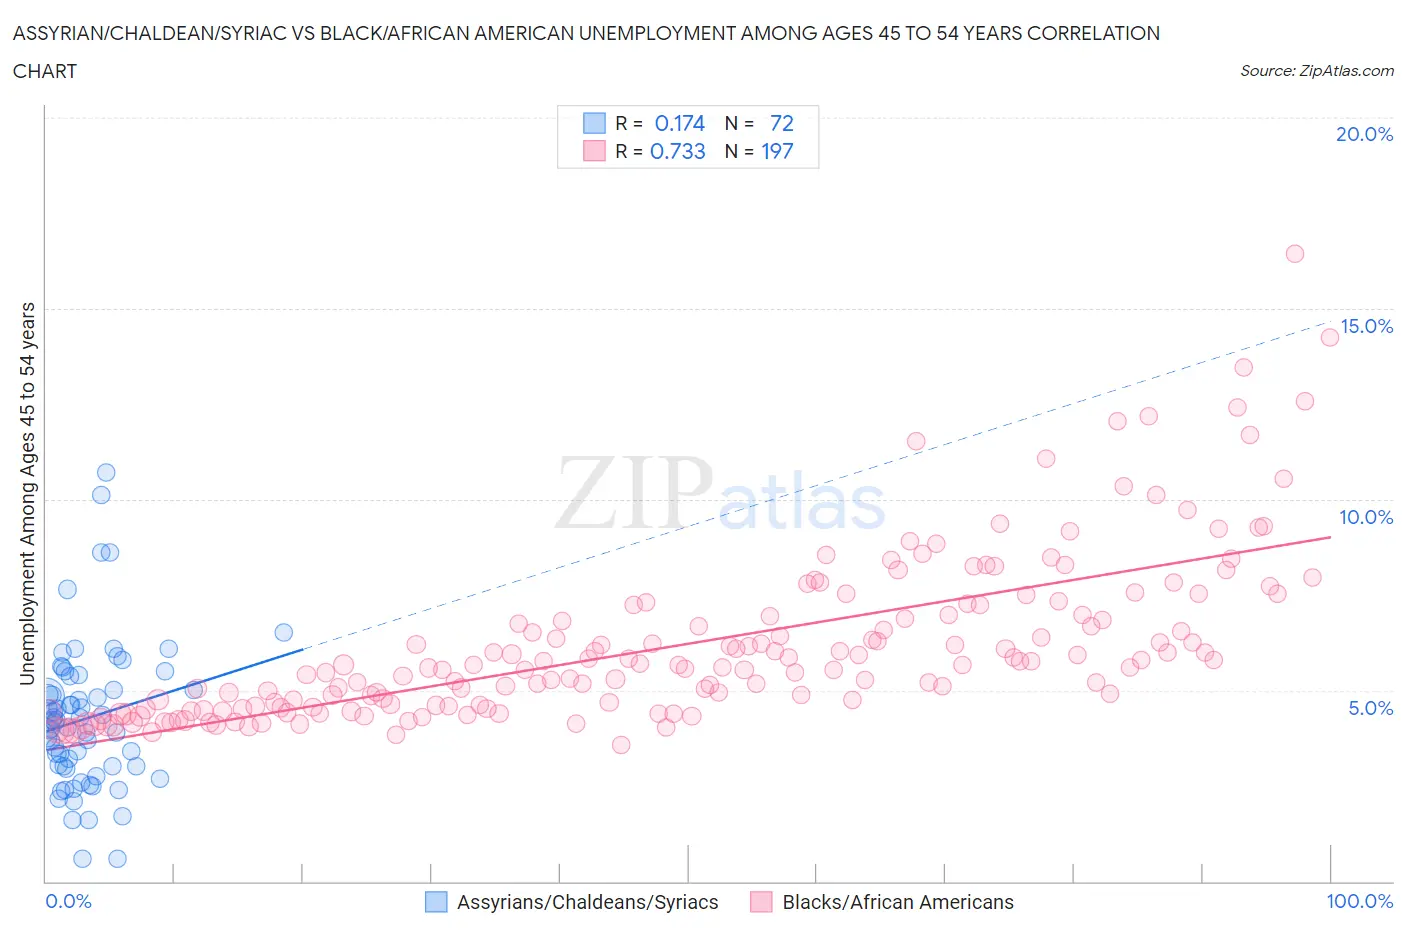
Assyrian/Chaldean/Syriac vs Black/African American Unemployment Among Ages 45 to 54 years Correlation Chart
The statistical analysis conducted on geographies consisting of 109,531,563 people shows a poor positive correlation between the proportion of Assyrians/Chaldeans/Syriacs and unemployment rate among population between the ages 45 and 54 in the United States with a correlation coefficient (R) of 0.174 and weighted average of 4.7%. Similarly, the statistical analysis conducted on geographies consisting of 527,917,947 people shows a strong positive correlation between the proportion of Blacks/African Americans and unemployment rate among population between the ages 45 and 54 in the United States with a correlation coefficient (R) of 0.733 and weighted average of 5.4%, a difference of 15.5%.
Unemployment Among Ages 45 to 54 years Correlation Summary
| Measurement | Assyrian/Chaldean/Syriac | Black/African American |
| Minimum | 0.60% | 3.6% |
| Maximum | 10.7% | 16.4% |
| Range | 10.1% | 12.9% |
| Mean | 4.3% | 6.2% |
| Median | 4.2% | 5.6% |
| Interquartile 25% (IQ1) | 3.0% | 4.6% |
| Interquartile 75% (IQ3) | 5.2% | 7.0% |
| Interquartile Range (IQR) | 2.2% | 2.4% |
| Standard Deviation (Sample) | 1.9% | 2.2% |
| Standard Deviation (Population) | 1.9% | 2.2% |
Similar Demographics by Unemployment Among Ages 45 to 54 years
Demographics Similar to Assyrians/Chaldeans/Syriacs by Unemployment Among Ages 45 to 54 years
In terms of unemployment among ages 45 to 54 years, the demographic groups most similar to Assyrians/Chaldeans/Syriacs are Iraqi (4.7%, a difference of 0.090%), South American Indian (4.7%, a difference of 0.12%), Immigrants from Israel (4.7%, a difference of 0.17%), Japanese (4.7%, a difference of 0.25%), and Immigrants from Ireland (4.7%, a difference of 0.29%).
| Demographics | Rating | Rank | Unemployment Among Ages 45 to 54 years |
| Nigerians | 7.0 /100 | #219 | Tragic 4.7% |
| Guamanians/Chamorros | 6.8 /100 | #220 | Tragic 4.7% |
| Choctaw | 6.1 /100 | #221 | Tragic 4.7% |
| Immigrants | Southern Europe | 6.0 /100 | #222 | Tragic 4.7% |
| Potawatomi | 5.7 /100 | #223 | Tragic 4.7% |
| Comanche | 4.8 /100 | #224 | Tragic 4.7% |
| Immigrants | Norway | 4.8 /100 | #225 | Tragic 4.7% |
| Assyrians/Chaldeans/Syriacs | 3.5 /100 | #226 | Tragic 4.7% |
| Iraqis | 3.2 /100 | #227 | Tragic 4.7% |
| South American Indians | 3.1 /100 | #228 | Tragic 4.7% |
| Immigrants | Israel | 3.0 /100 | #229 | Tragic 4.7% |
| Japanese | 2.8 /100 | #230 | Tragic 4.7% |
| Immigrants | Ireland | 2.7 /100 | #231 | Tragic 4.7% |
| Ottawa | 2.7 /100 | #232 | Tragic 4.7% |
| Immigrants | Immigrants | 2.6 /100 | #233 | Tragic 4.7% |
Demographics Similar to Blacks/African Americans by Unemployment Among Ages 45 to 54 years
In terms of unemployment among ages 45 to 54 years, the demographic groups most similar to Blacks/African Americans are Barbadian (5.5%, a difference of 0.65%), Vietnamese (5.4%, a difference of 0.76%), Immigrants from Barbados (5.5%, a difference of 0.80%), Immigrants from Bangladesh (5.4%, a difference of 1.0%), and Chippewa (5.5%, a difference of 1.1%).
| Demographics | Rating | Rank | Unemployment Among Ages 45 to 54 years |
| Menominee | 0.0 /100 | #301 | Tragic 5.3% |
| Immigrants | Ecuador | 0.0 /100 | #302 | Tragic 5.3% |
| Immigrants | Belize | 0.0 /100 | #303 | Tragic 5.3% |
| Immigrants | Jamaica | 0.0 /100 | #304 | Tragic 5.4% |
| Immigrants | West Indies | 0.0 /100 | #305 | Tragic 5.4% |
| Immigrants | Bangladesh | 0.0 /100 | #306 | Tragic 5.4% |
| Vietnamese | 0.0 /100 | #307 | Tragic 5.4% |
| Blacks/African Americans | 0.0 /100 | #308 | Tragic 5.4% |
| Barbadians | 0.0 /100 | #309 | Tragic 5.5% |
| Immigrants | Barbados | 0.0 /100 | #310 | Tragic 5.5% |
| Chippewa | 0.0 /100 | #311 | Tragic 5.5% |
| Immigrants | Grenada | 0.0 /100 | #312 | Tragic 5.6% |
| Shoshone | 0.0 /100 | #313 | Tragic 5.6% |
| Guyanese | 0.0 /100 | #314 | Tragic 5.6% |
| Immigrants | Dominica | 0.0 /100 | #315 | Tragic 5.6% |