Immigrants from Sierra Leone vs Alaska Native Unemployment Among Ages 20 to 24 years
COMPARE
Immigrants from Sierra Leone
Alaska Native
Unemployment Among Ages 20 to 24 years
Unemployment Among Ages 20 to 24 years Comparison
Immigrants from Sierra Leone
Alaska Natives
12.1%
UNEMPLOYMENT AMONG AGES 20 TO 24 YEARS
0.0/ 100
METRIC RATING
301st/ 347
METRIC RANK
13.2%
UNEMPLOYMENT AMONG AGES 20 TO 24 YEARS
0.0/ 100
METRIC RATING
324th/ 347
METRIC RANK
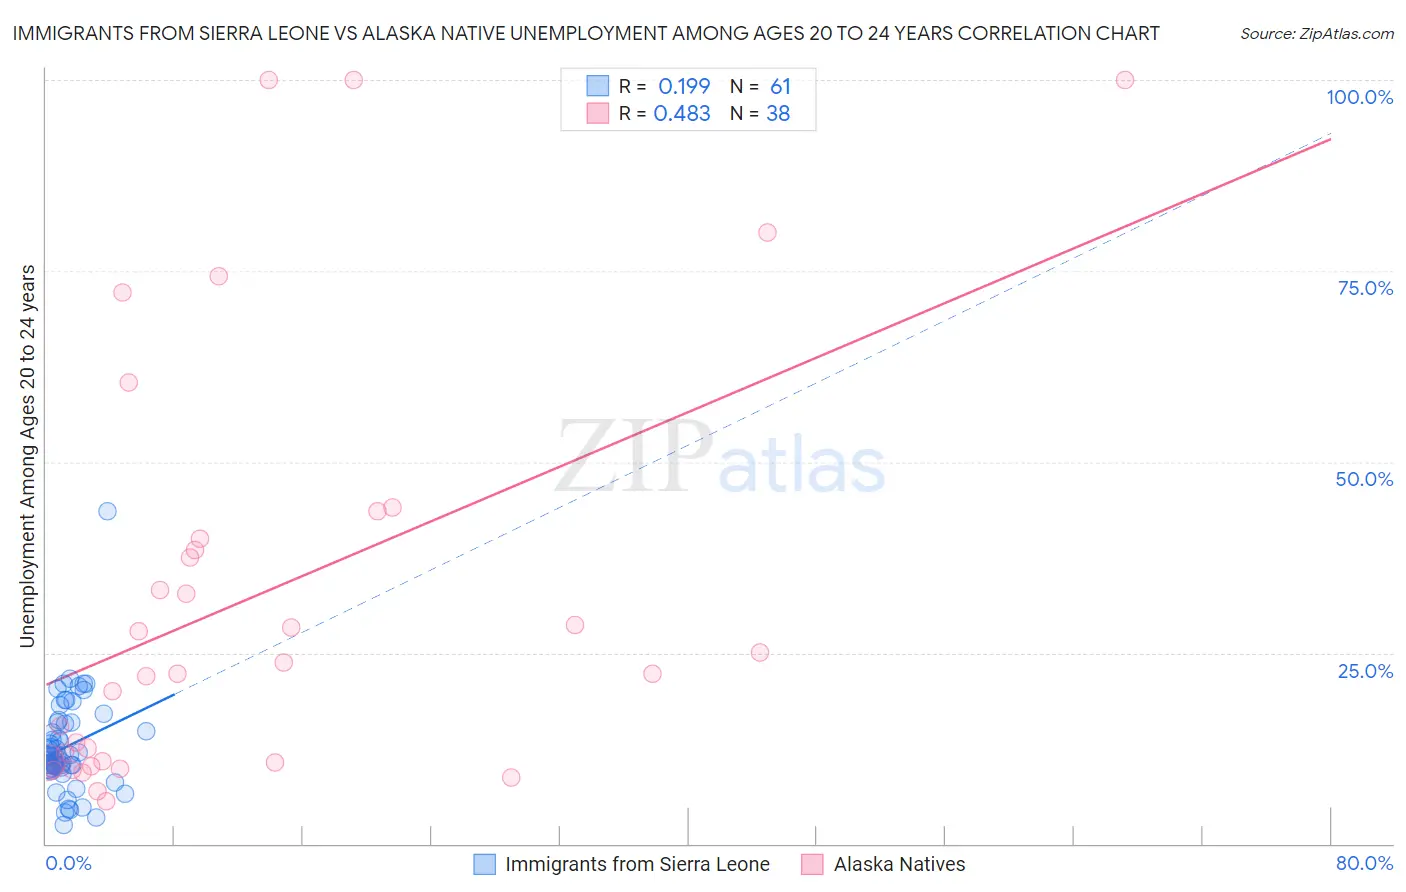
Immigrants from Sierra Leone vs Alaska Native Unemployment Among Ages 20 to 24 years Correlation Chart
The statistical analysis conducted on geographies consisting of 101,003,153 people shows a poor positive correlation between the proportion of Immigrants from Sierra Leone and unemployment rate among population between the ages 20 and 24 in the United States with a correlation coefficient (R) of 0.199 and weighted average of 12.1%. Similarly, the statistical analysis conducted on geographies consisting of 76,203,716 people shows a moderate positive correlation between the proportion of Alaska Natives and unemployment rate among population between the ages 20 and 24 in the United States with a correlation coefficient (R) of 0.483 and weighted average of 13.2%, a difference of 9.0%.
Unemployment Among Ages 20 to 24 years Correlation Summary
| Measurement | Immigrants from Sierra Leone | Alaska Native |
| Minimum | 2.5% | 5.6% |
| Maximum | 43.6% | 100.0% |
| Range | 41.1% | 94.4% |
| Mean | 12.7% | 32.4% |
| Median | 11.5% | 22.9% |
| Interquartile 25% (IQ1) | 10.0% | 10.6% |
| Interquartile 75% (IQ3) | 15.9% | 40.0% |
| Interquartile Range (IQR) | 5.9% | 29.4% |
| Standard Deviation (Sample) | 6.3% | 27.8% |
| Standard Deviation (Population) | 6.2% | 27.4% |
Similar Demographics by Unemployment Among Ages 20 to 24 years
Demographics Similar to Immigrants from Sierra Leone by Unemployment Among Ages 20 to 24 years
In terms of unemployment among ages 20 to 24 years, the demographic groups most similar to Immigrants from Sierra Leone are Spanish American Indian (12.1%, a difference of 0.49%), Apache (12.0%, a difference of 0.64%), Lumbee (12.0%, a difference of 0.67%), Immigrants from Cabo Verde (12.2%, a difference of 0.85%), and Haitian (12.2%, a difference of 0.87%).
| Demographics | Rating | Rank | Unemployment Among Ages 20 to 24 years |
| Immigrants | Belize | 0.0 /100 | #294 | Tragic 12.0% |
| Immigrants | Armenia | 0.0 /100 | #295 | Tragic 12.0% |
| Cajuns | 0.0 /100 | #296 | Tragic 12.0% |
| Blackfeet | 0.0 /100 | #297 | Tragic 12.0% |
| Lumbee | 0.0 /100 | #298 | Tragic 12.0% |
| Apache | 0.0 /100 | #299 | Tragic 12.0% |
| Spanish American Indians | 0.0 /100 | #300 | Tragic 12.1% |
| Immigrants | Sierra Leone | 0.0 /100 | #301 | Tragic 12.1% |
| Immigrants | Cabo Verde | 0.0 /100 | #302 | Tragic 12.2% |
| Haitians | 0.0 /100 | #303 | Tragic 12.2% |
| Immigrants | West Indies | 0.0 /100 | #304 | Tragic 12.3% |
| Chippewa | 0.0 /100 | #305 | Tragic 12.3% |
| Immigrants | Haiti | 0.0 /100 | #306 | Tragic 12.4% |
| Bermudans | 0.0 /100 | #307 | Tragic 12.5% |
| Tohono O'odham | 0.0 /100 | #308 | Tragic 12.5% |
Demographics Similar to Alaska Natives by Unemployment Among Ages 20 to 24 years
In terms of unemployment among ages 20 to 24 years, the demographic groups most similar to Alaska Natives are Pueblo (13.2%, a difference of 0.22%), Yakama (13.1%, a difference of 0.98%), Native/Alaskan (13.0%, a difference of 1.5%), Immigrants from Jamaica (13.0%, a difference of 1.8%), and Cheyenne (13.0%, a difference of 1.9%).
| Demographics | Rating | Rank | Unemployment Among Ages 20 to 24 years |
| Immigrants | Trinidad and Tobago | 0.0 /100 | #317 | Tragic 12.8% |
| Barbadians | 0.0 /100 | #318 | Tragic 12.9% |
| Trinidadians and Tobagonians | 0.0 /100 | #319 | Tragic 12.9% |
| Cheyenne | 0.0 /100 | #320 | Tragic 13.0% |
| Immigrants | Jamaica | 0.0 /100 | #321 | Tragic 13.0% |
| Natives/Alaskans | 0.0 /100 | #322 | Tragic 13.0% |
| Yakama | 0.0 /100 | #323 | Tragic 13.1% |
| Alaska Natives | 0.0 /100 | #324 | Tragic 13.2% |
| Pueblo | 0.0 /100 | #325 | Tragic 13.2% |
| Immigrants | Barbados | 0.0 /100 | #326 | Tragic 13.5% |
| Immigrants | Dominican Republic | 0.0 /100 | #327 | Tragic 13.6% |
| British West Indians | 0.0 /100 | #328 | Tragic 13.7% |
| Dominicans | 0.0 /100 | #329 | Tragic 13.8% |
| Arapaho | 0.0 /100 | #330 | Tragic 13.8% |
| Aleuts | 0.0 /100 | #331 | Tragic 13.8% |