Asian vs Crow Male Unemployment
COMPARE
Asian
Crow
Male Unemployment
Male Unemployment Comparison
Asians
Crow
5.1%
MALE UNEMPLOYMENT
93.7/ 100
METRIC RATING
96th/ 347
METRIC RANK
10.6%
MALE UNEMPLOYMENT
0.0/ 100
METRIC RATING
343rd/ 347
METRIC RANK
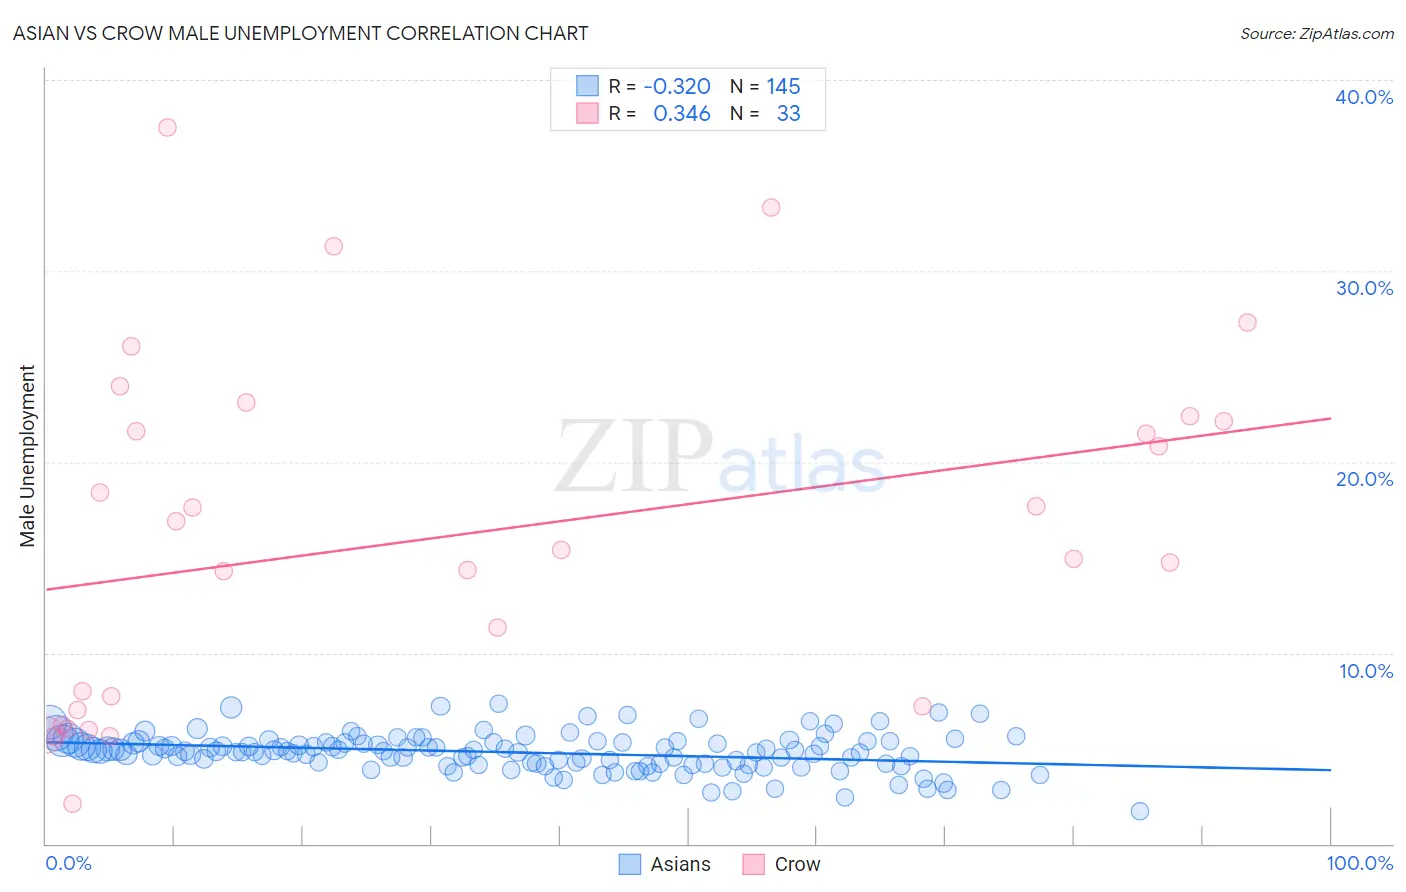
Asian vs Crow Male Unemployment Correlation Chart
The statistical analysis conducted on geographies consisting of 543,892,334 people shows a mild negative correlation between the proportion of Asians and unemployment rate among males in the United States with a correlation coefficient (R) of -0.320 and weighted average of 5.1%. Similarly, the statistical analysis conducted on geographies consisting of 59,099,043 people shows a mild positive correlation between the proportion of Crow and unemployment rate among males in the United States with a correlation coefficient (R) of 0.346 and weighted average of 10.6%, a difference of 108.6%.
Male Unemployment Correlation Summary
| Measurement | Asian | Crow |
| Minimum | 1.7% | 2.1% |
| Maximum | 7.3% | 37.5% |
| Range | 5.6% | 35.4% |
| Mean | 4.8% | 16.2% |
| Median | 4.8% | 15.4% |
| Interquartile 25% (IQ1) | 4.2% | 7.1% |
| Interquartile 75% (IQ3) | 5.3% | 22.3% |
| Interquartile Range (IQR) | 1.1% | 15.1% |
| Standard Deviation (Sample) | 0.98% | 9.1% |
| Standard Deviation (Population) | 0.98% | 9.0% |
Similar Demographics by Male Unemployment
Demographics Similar to Asians by Male Unemployment
In terms of male unemployment, the demographic groups most similar to Asians are Italian (5.1%, a difference of 0.030%), Immigrants from Spain (5.1%, a difference of 0.070%), Canadian (5.1%, a difference of 0.10%), Immigrants from Kuwait (5.1%, a difference of 0.11%), and Slavic (5.1%, a difference of 0.15%).
| Demographics | Rating | Rank | Male Unemployment |
| Immigrants | Australia | 94.7 /100 | #89 | Exceptional 5.1% |
| Okinawans | 94.7 /100 | #90 | Exceptional 5.1% |
| Immigrants | Turkey | 94.4 /100 | #91 | Exceptional 5.1% |
| Slavs | 94.2 /100 | #92 | Exceptional 5.1% |
| Immigrants | Serbia | 94.2 /100 | #93 | Exceptional 5.1% |
| Canadians | 94.1 /100 | #94 | Exceptional 5.1% |
| Italians | 93.8 /100 | #95 | Exceptional 5.1% |
| Asians | 93.7 /100 | #96 | Exceptional 5.1% |
| Immigrants | Spain | 93.4 /100 | #97 | Exceptional 5.1% |
| Immigrants | Kuwait | 93.3 /100 | #98 | Exceptional 5.1% |
| Uruguayans | 93.0 /100 | #99 | Exceptional 5.1% |
| Russians | 92.9 /100 | #100 | Exceptional 5.1% |
| German Russians | 92.7 /100 | #101 | Exceptional 5.1% |
| Immigrants | France | 92.7 /100 | #102 | Exceptional 5.1% |
| Immigrants | Jordan | 91.9 /100 | #103 | Exceptional 5.1% |
Demographics Similar to Crow by Male Unemployment
In terms of male unemployment, the demographic groups most similar to Crow are Hopi (10.8%, a difference of 1.7%), Arapaho (11.0%, a difference of 3.7%), Tohono O'odham (10.2%, a difference of 4.4%), Navajo (9.8%, a difference of 7.9%), and Alaskan Athabascan (9.8%, a difference of 8.2%).
| Demographics | Rating | Rank | Male Unemployment |
| Sioux | 0.0 /100 | #333 | Tragic 8.4% |
| Tsimshian | 0.0 /100 | #334 | Tragic 8.5% |
| Pueblo | 0.0 /100 | #335 | Tragic 8.5% |
| Yuman | 0.0 /100 | #336 | Tragic 8.6% |
| Puerto Ricans | 0.0 /100 | #337 | Tragic 8.6% |
| Apache | 0.0 /100 | #338 | Tragic 8.6% |
| Cheyenne | 0.0 /100 | #339 | Tragic 9.8% |
| Alaskan Athabascans | 0.0 /100 | #340 | Tragic 9.8% |
| Navajo | 0.0 /100 | #341 | Tragic 9.8% |
| Tohono O'odham | 0.0 /100 | #342 | Tragic 10.2% |
| Crow | 0.0 /100 | #343 | Tragic 10.6% |
| Hopi | 0.0 /100 | #344 | Tragic 10.8% |
| Arapaho | 0.0 /100 | #345 | Tragic 11.0% |
| Inupiat | 0.0 /100 | #346 | Tragic 12.1% |
| Yup'ik | 0.0 /100 | #347 | Tragic 16.4% |