Arapaho vs South African Unemployment Among Ages 60 to 64 years
COMPARE
Arapaho
South African
Unemployment Among Ages 60 to 64 years
Unemployment Among Ages 60 to 64 years Comparison
Arapaho
South Africans
6.3%
UNEMPLOYMENT AMONG AGES 60 TO 64 YEARS
0.0/ 100
METRIC RATING
338th/ 347
METRIC RANK
4.8%
UNEMPLOYMENT AMONG AGES 60 TO 64 YEARS
65.1/ 100
METRIC RATING
162nd/ 347
METRIC RANK
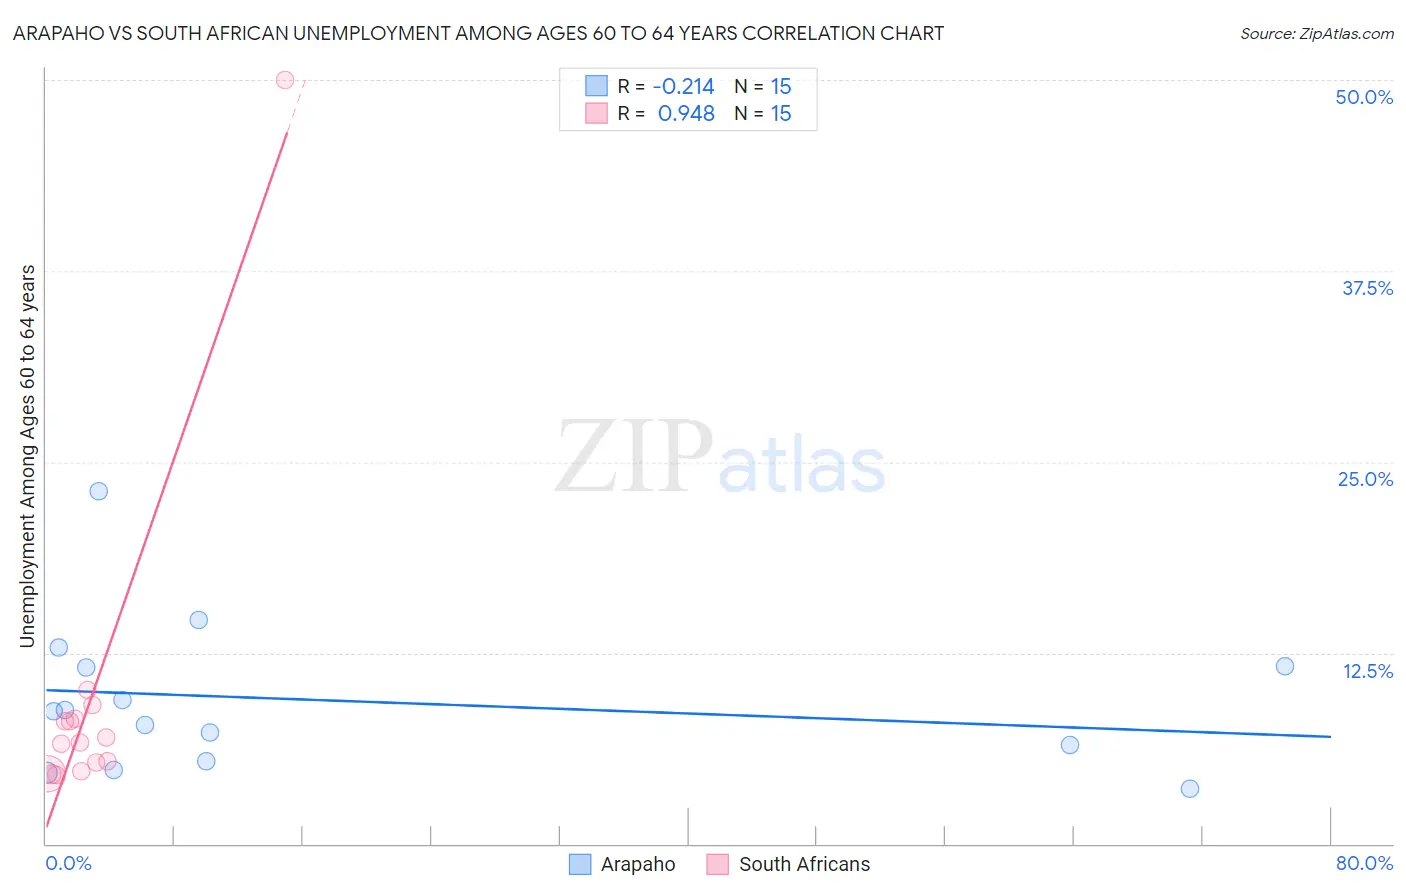
Arapaho vs South African Unemployment Among Ages 60 to 64 years Correlation Chart
The statistical analysis conducted on geographies consisting of 28,591,574 people shows a weak negative correlation between the proportion of Arapaho and unemployment rate among population between the ages 60 and 64 in the United States with a correlation coefficient (R) of -0.214 and weighted average of 6.3%. Similarly, the statistical analysis conducted on geographies consisting of 172,703,544 people shows a near-perfect positive correlation between the proportion of South Africans and unemployment rate among population between the ages 60 and 64 in the United States with a correlation coefficient (R) of 0.948 and weighted average of 4.8%, a difference of 30.3%.
Unemployment Among Ages 60 to 64 years Correlation Summary
| Measurement | Arapaho | South African |
| Minimum | 3.6% | 4.5% |
| Maximum | 23.1% | 50.0% |
| Range | 19.5% | 45.5% |
| Mean | 9.4% | 9.5% |
| Median | 8.7% | 6.6% |
| Interquartile 25% (IQ1) | 5.4% | 4.8% |
| Interquartile 75% (IQ3) | 11.6% | 8.2% |
| Interquartile Range (IQR) | 6.2% | 3.4% |
| Standard Deviation (Sample) | 5.0% | 11.3% |
| Standard Deviation (Population) | 4.8% | 11.0% |
Similar Demographics by Unemployment Among Ages 60 to 64 years
Demographics Similar to Arapaho by Unemployment Among Ages 60 to 64 years
In terms of unemployment among ages 60 to 64 years, the demographic groups most similar to Arapaho are Navajo (6.3%, a difference of 0.48%), Tlingit-Haida (6.4%, a difference of 1.4%), Kiowa (6.2%, a difference of 1.6%), Vietnamese (6.1%, a difference of 3.5%), and Puerto Rican (6.1%, a difference of 3.7%).
| Demographics | Rating | Rank | Unemployment Among Ages 60 to 64 years |
| Yakama | 0.0 /100 | #331 | Tragic 6.0% |
| Dominicans | 0.0 /100 | #332 | Tragic 6.0% |
| Immigrants | Dominican Republic | 0.0 /100 | #333 | Tragic 6.0% |
| Puerto Ricans | 0.0 /100 | #334 | Tragic 6.1% |
| Vietnamese | 0.0 /100 | #335 | Tragic 6.1% |
| Kiowa | 0.0 /100 | #336 | Tragic 6.2% |
| Navajo | 0.0 /100 | #337 | Tragic 6.3% |
| Arapaho | 0.0 /100 | #338 | Tragic 6.3% |
| Tlingit-Haida | 0.0 /100 | #339 | Tragic 6.4% |
| Pueblo | 0.0 /100 | #340 | Tragic 6.7% |
| Yuman | 0.0 /100 | #341 | Tragic 6.8% |
| Aleuts | 0.0 /100 | #342 | Tragic 6.8% |
| Immigrants | Yemen | 0.0 /100 | #343 | Tragic 6.8% |
| Alaska Natives | 0.0 /100 | #344 | Tragic 7.6% |
| Alaskan Athabascans | 0.0 /100 | #345 | Tragic 8.4% |
Demographics Similar to South Africans by Unemployment Among Ages 60 to 64 years
In terms of unemployment among ages 60 to 64 years, the demographic groups most similar to South Africans are Immigrants from Norway (4.8%, a difference of 0.0%), Australian (4.8%, a difference of 0.010%), Immigrants from Belgium (4.8%, a difference of 0.010%), Spanish (4.8%, a difference of 0.020%), and Pakistani (4.8%, a difference of 0.020%).
| Demographics | Rating | Rank | Unemployment Among Ages 60 to 64 years |
| Filipinos | 72.1 /100 | #155 | Good 4.8% |
| Immigrants | Bolivia | 69.2 /100 | #156 | Good 4.8% |
| Laotians | 66.8 /100 | #157 | Good 4.8% |
| Immigrants | Taiwan | 66.0 /100 | #158 | Good 4.8% |
| Spanish | 65.5 /100 | #159 | Good 4.8% |
| Australians | 65.3 /100 | #160 | Good 4.8% |
| Immigrants | Norway | 65.1 /100 | #161 | Good 4.8% |
| South Africans | 65.1 /100 | #162 | Good 4.8% |
| Immigrants | Belgium | 64.8 /100 | #163 | Good 4.8% |
| Pakistanis | 64.6 /100 | #164 | Good 4.8% |
| Immigrants | Panama | 62.0 /100 | #165 | Good 4.8% |
| Palestinians | 60.5 /100 | #166 | Good 4.8% |
| Immigrants | Northern Europe | 59.1 /100 | #167 | Average 4.8% |
| Immigrants | Southern Europe | 56.7 /100 | #168 | Average 4.8% |
| Immigrants | France | 55.5 /100 | #169 | Average 4.8% |