Immigrants from Congo vs South African Unemployment Among Ages 60 to 64 years
COMPARE
Immigrants from Congo
South African
Unemployment Among Ages 60 to 64 years
Unemployment Among Ages 60 to 64 years Comparison
Immigrants from Congo
South Africans
4.1%
UNEMPLOYMENT AMONG AGES 60 TO 64 YEARS
100.0/ 100
METRIC RATING
6th/ 347
METRIC RANK
4.8%
UNEMPLOYMENT AMONG AGES 60 TO 64 YEARS
65.1/ 100
METRIC RATING
162nd/ 347
METRIC RANK
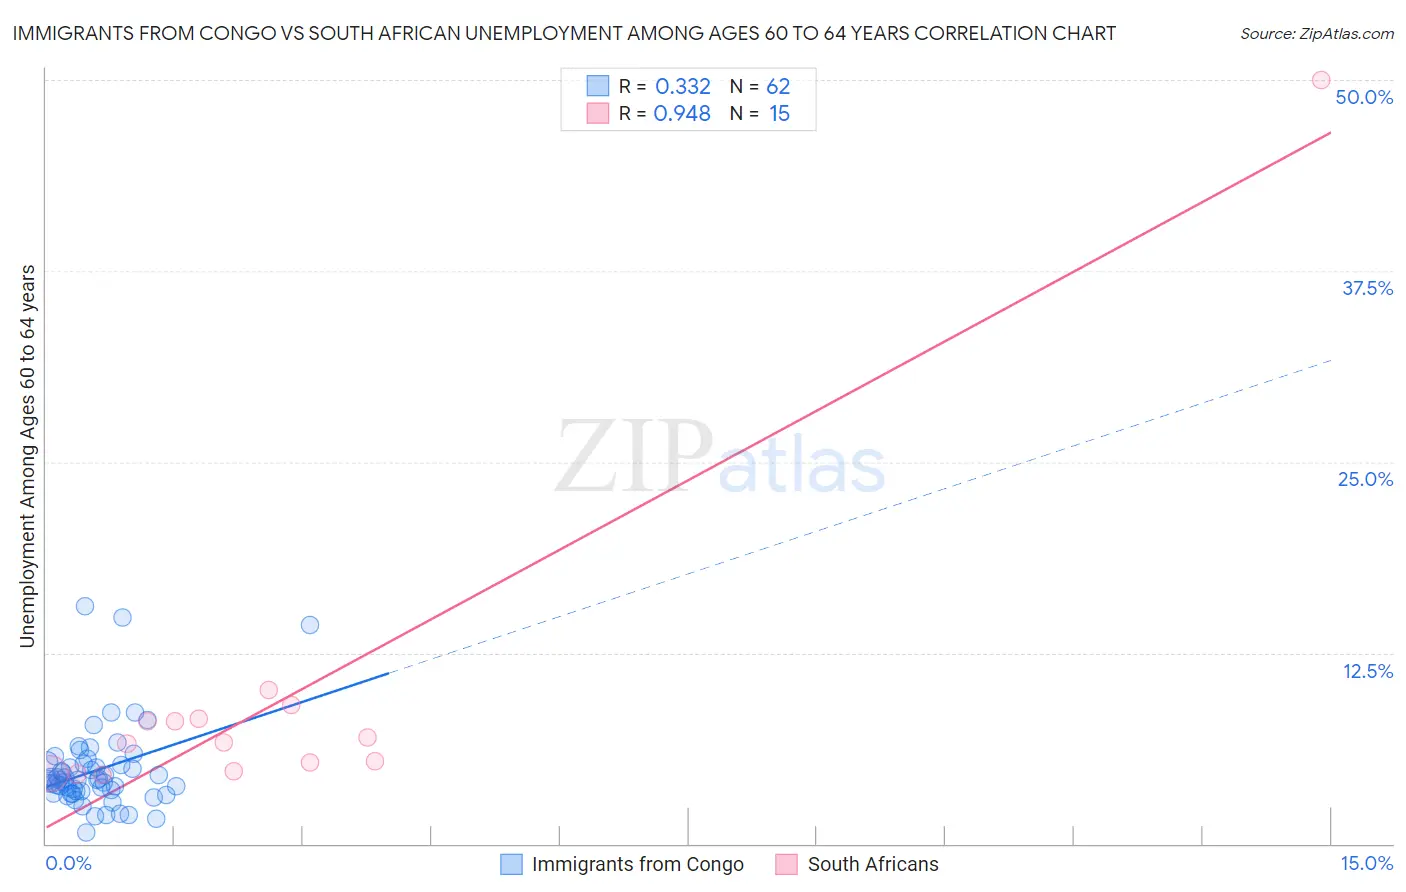
Immigrants from Congo vs South African Unemployment Among Ages 60 to 64 years Correlation Chart
The statistical analysis conducted on geographies consisting of 89,429,972 people shows a mild positive correlation between the proportion of Immigrants from Congo and unemployment rate among population between the ages 60 and 64 in the United States with a correlation coefficient (R) of 0.332 and weighted average of 4.1%. Similarly, the statistical analysis conducted on geographies consisting of 172,703,544 people shows a near-perfect positive correlation between the proportion of South Africans and unemployment rate among population between the ages 60 and 64 in the United States with a correlation coefficient (R) of 0.948 and weighted average of 4.8%, a difference of 17.1%.
Unemployment Among Ages 60 to 64 years Correlation Summary
| Measurement | Immigrants from Congo | South African |
| Minimum | 0.70% | 4.5% |
| Maximum | 15.5% | 50.0% |
| Range | 14.8% | 45.5% |
| Mean | 4.8% | 9.5% |
| Median | 4.2% | 6.6% |
| Interquartile 25% (IQ1) | 3.4% | 4.8% |
| Interquartile 75% (IQ3) | 5.2% | 8.2% |
| Interquartile Range (IQR) | 1.8% | 3.4% |
| Standard Deviation (Sample) | 2.8% | 11.3% |
| Standard Deviation (Population) | 2.8% | 11.0% |
Similar Demographics by Unemployment Among Ages 60 to 64 years
Demographics Similar to Immigrants from Congo by Unemployment Among Ages 60 to 64 years
In terms of unemployment among ages 60 to 64 years, the demographic groups most similar to Immigrants from Congo are Lumbee (4.2%, a difference of 0.91%), Immigrants from Micronesia (4.2%, a difference of 2.1%), Indonesian (4.2%, a difference of 2.6%), Immigrants from the Azores (4.0%, a difference of 2.7%), and Hmong (4.0%, a difference of 2.7%).
| Demographics | Rating | Rank | Unemployment Among Ages 60 to 64 years |
| Marshallese | 100.0 /100 | #1 | Exceptional 3.7% |
| Fijians | 100.0 /100 | #2 | Exceptional 3.9% |
| Chinese | 100.0 /100 | #3 | Exceptional 4.0% |
| Hmong | 100.0 /100 | #4 | Exceptional 4.0% |
| Immigrants | Azores | 100.0 /100 | #5 | Exceptional 4.0% |
| Immigrants | Congo | 100.0 /100 | #6 | Exceptional 4.1% |
| Lumbee | 100.0 /100 | #7 | Exceptional 4.2% |
| Immigrants | Micronesia | 100.0 /100 | #8 | Exceptional 4.2% |
| Indonesians | 100.0 /100 | #9 | Exceptional 4.2% |
| Immigrants | Bosnia and Herzegovina | 100.0 /100 | #10 | Exceptional 4.2% |
| Luxembourgers | 100.0 /100 | #11 | Exceptional 4.3% |
| Immigrants | Cuba | 100.0 /100 | #12 | Exceptional 4.3% |
| Chickasaw | 100.0 /100 | #13 | Exceptional 4.3% |
| Norwegians | 100.0 /100 | #14 | Exceptional 4.3% |
| Sudanese | 100.0 /100 | #15 | Exceptional 4.3% |
Demographics Similar to South Africans by Unemployment Among Ages 60 to 64 years
In terms of unemployment among ages 60 to 64 years, the demographic groups most similar to South Africans are Immigrants from Norway (4.8%, a difference of 0.0%), Australian (4.8%, a difference of 0.010%), Immigrants from Belgium (4.8%, a difference of 0.010%), Spanish (4.8%, a difference of 0.020%), and Pakistani (4.8%, a difference of 0.020%).
| Demographics | Rating | Rank | Unemployment Among Ages 60 to 64 years |
| Filipinos | 72.1 /100 | #155 | Good 4.8% |
| Immigrants | Bolivia | 69.2 /100 | #156 | Good 4.8% |
| Laotians | 66.8 /100 | #157 | Good 4.8% |
| Immigrants | Taiwan | 66.0 /100 | #158 | Good 4.8% |
| Spanish | 65.5 /100 | #159 | Good 4.8% |
| Australians | 65.3 /100 | #160 | Good 4.8% |
| Immigrants | Norway | 65.1 /100 | #161 | Good 4.8% |
| South Africans | 65.1 /100 | #162 | Good 4.8% |
| Immigrants | Belgium | 64.8 /100 | #163 | Good 4.8% |
| Pakistanis | 64.6 /100 | #164 | Good 4.8% |
| Immigrants | Panama | 62.0 /100 | #165 | Good 4.8% |
| Palestinians | 60.5 /100 | #166 | Good 4.8% |
| Immigrants | Northern Europe | 59.1 /100 | #167 | Average 4.8% |
| Immigrants | Southern Europe | 56.7 /100 | #168 | Average 4.8% |
| Immigrants | France | 55.5 /100 | #169 | Average 4.8% |