Arapaho vs Immigrants from Bosnia and Herzegovina Unemployment Among Ages 60 to 64 years
COMPARE
Arapaho
Immigrants from Bosnia and Herzegovina
Unemployment Among Ages 60 to 64 years
Unemployment Among Ages 60 to 64 years Comparison
Arapaho
Immigrants from Bosnia and Herzegovina
6.3%
UNEMPLOYMENT AMONG AGES 60 TO 64 YEARS
0.0/ 100
METRIC RATING
338th/ 347
METRIC RANK
4.2%
UNEMPLOYMENT AMONG AGES 60 TO 64 YEARS
100.0/ 100
METRIC RATING
10th/ 347
METRIC RANK
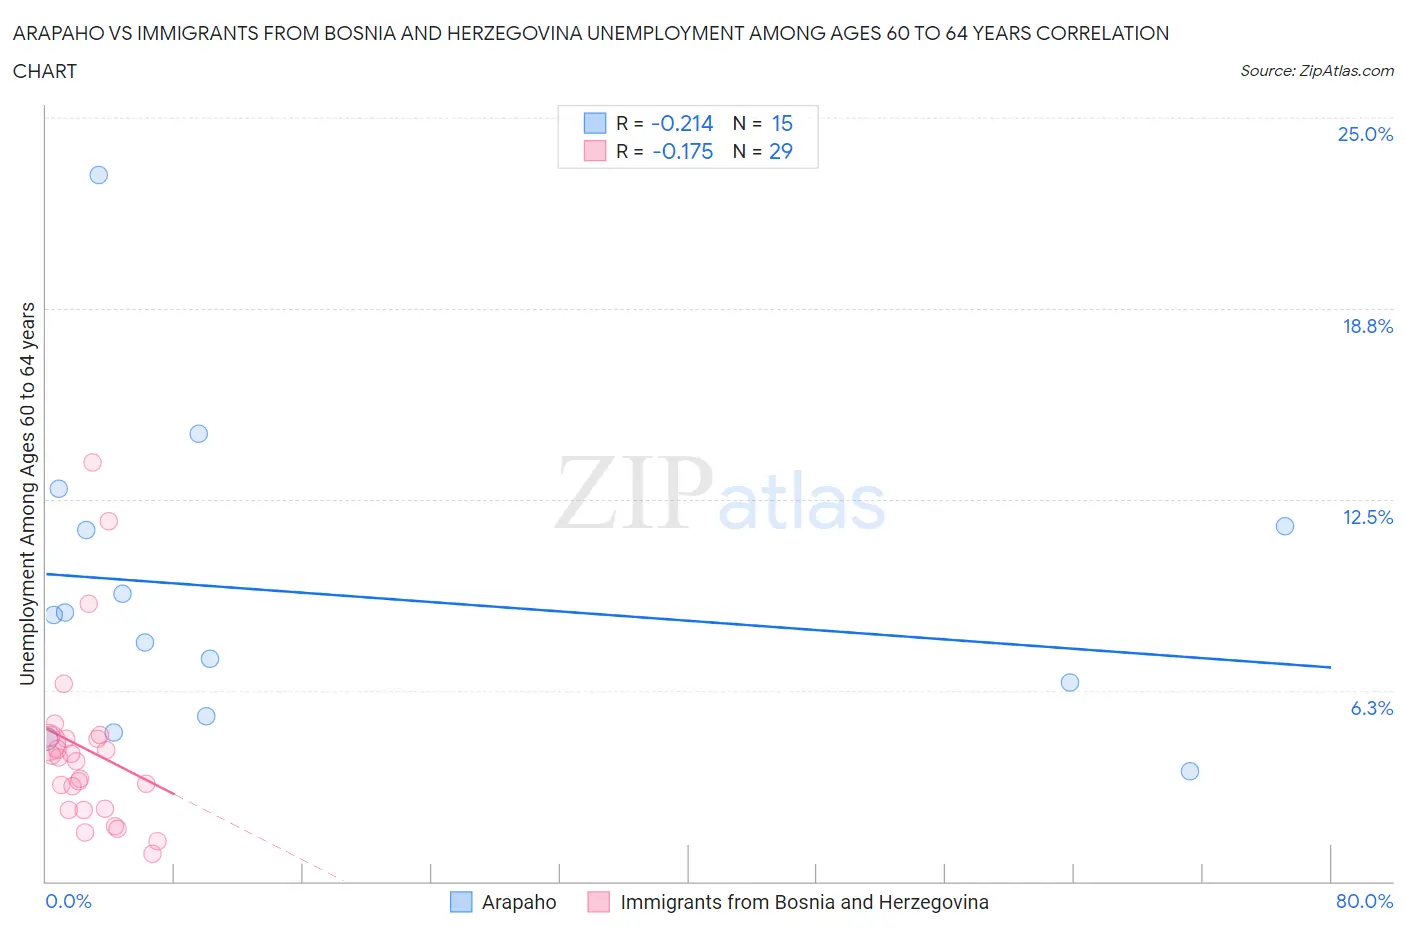
Arapaho vs Immigrants from Bosnia and Herzegovina Unemployment Among Ages 60 to 64 years Correlation Chart
The statistical analysis conducted on geographies consisting of 28,591,574 people shows a weak negative correlation between the proportion of Arapaho and unemployment rate among population between the ages 60 and 64 in the United States with a correlation coefficient (R) of -0.214 and weighted average of 6.3%. Similarly, the statistical analysis conducted on geographies consisting of 149,200,832 people shows a poor negative correlation between the proportion of Immigrants from Bosnia and Herzegovina and unemployment rate among population between the ages 60 and 64 in the United States with a correlation coefficient (R) of -0.175 and weighted average of 4.2%, a difference of 48.2%.
Unemployment Among Ages 60 to 64 years Correlation Summary
| Measurement | Arapaho | Immigrants from Bosnia and Herzegovina |
| Minimum | 3.6% | 0.90% |
| Maximum | 23.1% | 13.7% |
| Range | 19.5% | 12.8% |
| Mean | 9.4% | 4.3% |
| Median | 8.7% | 4.0% |
| Interquartile 25% (IQ1) | 5.4% | 2.4% |
| Interquartile 75% (IQ3) | 11.6% | 4.7% |
| Interquartile Range (IQR) | 6.2% | 2.4% |
| Standard Deviation (Sample) | 5.0% | 2.9% |
| Standard Deviation (Population) | 4.8% | 2.8% |
Similar Demographics by Unemployment Among Ages 60 to 64 years
Demographics Similar to Arapaho by Unemployment Among Ages 60 to 64 years
In terms of unemployment among ages 60 to 64 years, the demographic groups most similar to Arapaho are Navajo (6.3%, a difference of 0.48%), Tlingit-Haida (6.4%, a difference of 1.4%), Kiowa (6.2%, a difference of 1.6%), Vietnamese (6.1%, a difference of 3.5%), and Puerto Rican (6.1%, a difference of 3.7%).
| Demographics | Rating | Rank | Unemployment Among Ages 60 to 64 years |
| Yakama | 0.0 /100 | #331 | Tragic 6.0% |
| Dominicans | 0.0 /100 | #332 | Tragic 6.0% |
| Immigrants | Dominican Republic | 0.0 /100 | #333 | Tragic 6.0% |
| Puerto Ricans | 0.0 /100 | #334 | Tragic 6.1% |
| Vietnamese | 0.0 /100 | #335 | Tragic 6.1% |
| Kiowa | 0.0 /100 | #336 | Tragic 6.2% |
| Navajo | 0.0 /100 | #337 | Tragic 6.3% |
| Arapaho | 0.0 /100 | #338 | Tragic 6.3% |
| Tlingit-Haida | 0.0 /100 | #339 | Tragic 6.4% |
| Pueblo | 0.0 /100 | #340 | Tragic 6.7% |
| Yuman | 0.0 /100 | #341 | Tragic 6.8% |
| Aleuts | 0.0 /100 | #342 | Tragic 6.8% |
| Immigrants | Yemen | 0.0 /100 | #343 | Tragic 6.8% |
| Alaska Natives | 0.0 /100 | #344 | Tragic 7.6% |
| Alaskan Athabascans | 0.0 /100 | #345 | Tragic 8.4% |
Demographics Similar to Immigrants from Bosnia and Herzegovina by Unemployment Among Ages 60 to 64 years
In terms of unemployment among ages 60 to 64 years, the demographic groups most similar to Immigrants from Bosnia and Herzegovina are Indonesian (4.2%, a difference of 0.36%), Luxembourger (4.3%, a difference of 0.74%), Immigrants from Micronesia (4.2%, a difference of 0.87%), Immigrants from Cuba (4.3%, a difference of 1.8%), and Chickasaw (4.3%, a difference of 1.8%).
| Demographics | Rating | Rank | Unemployment Among Ages 60 to 64 years |
| Chinese | 100.0 /100 | #3 | Exceptional 4.0% |
| Hmong | 100.0 /100 | #4 | Exceptional 4.0% |
| Immigrants | Azores | 100.0 /100 | #5 | Exceptional 4.0% |
| Immigrants | Congo | 100.0 /100 | #6 | Exceptional 4.1% |
| Lumbee | 100.0 /100 | #7 | Exceptional 4.2% |
| Immigrants | Micronesia | 100.0 /100 | #8 | Exceptional 4.2% |
| Indonesians | 100.0 /100 | #9 | Exceptional 4.2% |
| Immigrants | Bosnia and Herzegovina | 100.0 /100 | #10 | Exceptional 4.2% |
| Luxembourgers | 100.0 /100 | #11 | Exceptional 4.3% |
| Immigrants | Cuba | 100.0 /100 | #12 | Exceptional 4.3% |
| Chickasaw | 100.0 /100 | #13 | Exceptional 4.3% |
| Norwegians | 100.0 /100 | #14 | Exceptional 4.3% |
| Sudanese | 100.0 /100 | #15 | Exceptional 4.3% |
| Danes | 100.0 /100 | #16 | Exceptional 4.4% |
| Immigrants | Afghanistan | 100.0 /100 | #17 | Exceptional 4.4% |