Arapaho vs Pennsylvania German Unemployment Among Ages 60 to 64 years
COMPARE
Arapaho
Pennsylvania German
Unemployment Among Ages 60 to 64 years
Unemployment Among Ages 60 to 64 years Comparison
Arapaho
Pennsylvania Germans
6.3%
UNEMPLOYMENT AMONG AGES 60 TO 64 YEARS
0.0/ 100
METRIC RATING
338th/ 347
METRIC RANK
4.8%
UNEMPLOYMENT AMONG AGES 60 TO 64 YEARS
87.8/ 100
METRIC RATING
135th/ 347
METRIC RANK
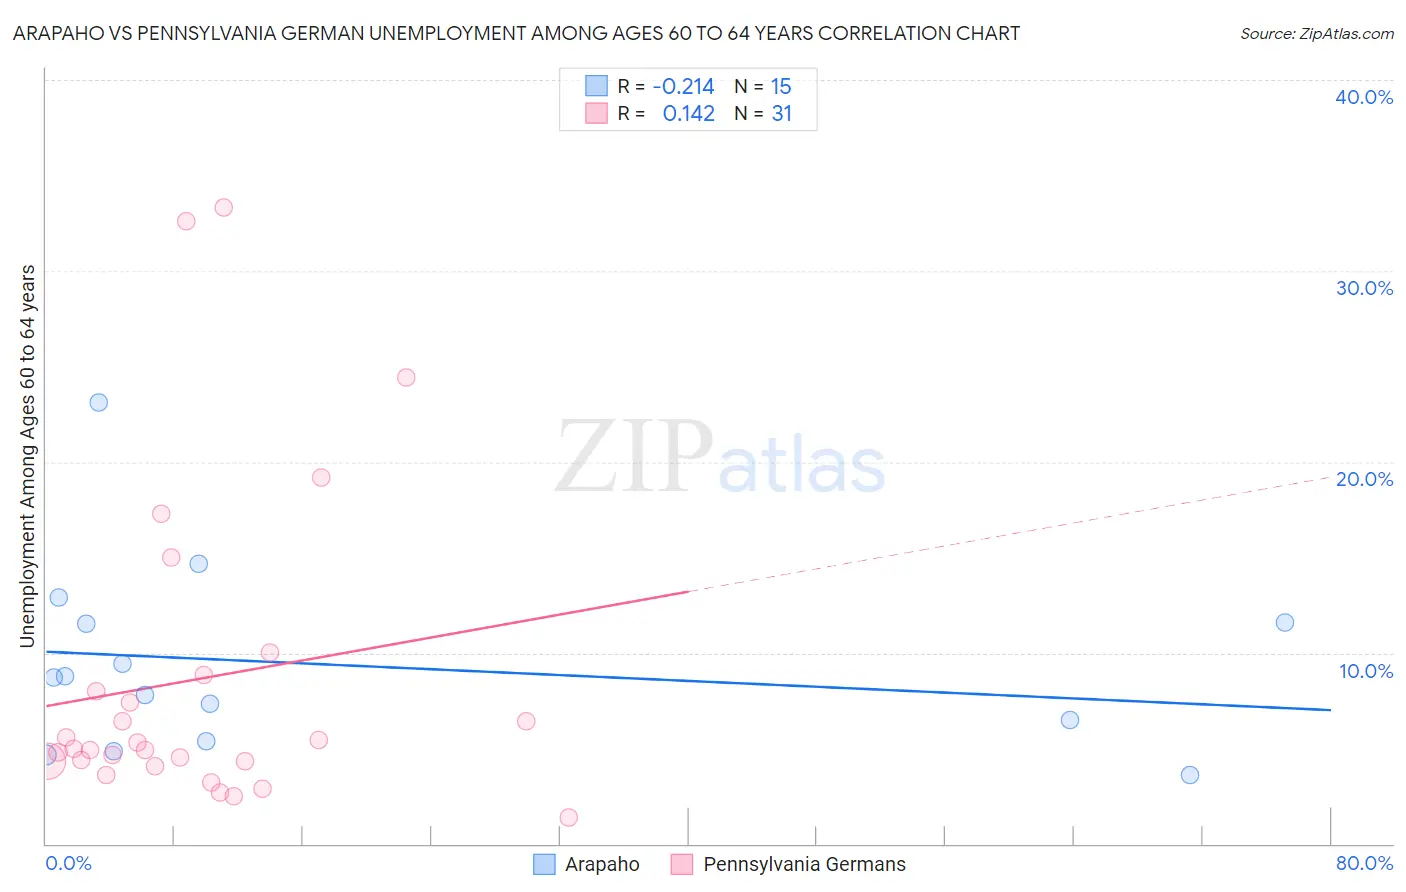
Arapaho vs Pennsylvania German Unemployment Among Ages 60 to 64 years Correlation Chart
The statistical analysis conducted on geographies consisting of 28,591,574 people shows a weak negative correlation between the proportion of Arapaho and unemployment rate among population between the ages 60 and 64 in the United States with a correlation coefficient (R) of -0.214 and weighted average of 6.3%. Similarly, the statistical analysis conducted on geographies consisting of 211,890,030 people shows a poor positive correlation between the proportion of Pennsylvania Germans and unemployment rate among population between the ages 60 and 64 in the United States with a correlation coefficient (R) of 0.142 and weighted average of 4.8%, a difference of 31.9%.
Unemployment Among Ages 60 to 64 years Correlation Summary
| Measurement | Arapaho | Pennsylvania German |
| Minimum | 3.6% | 1.4% |
| Maximum | 23.1% | 33.3% |
| Range | 19.5% | 31.9% |
| Mean | 9.4% | 8.6% |
| Median | 8.7% | 5.0% |
| Interquartile 25% (IQ1) | 5.4% | 4.3% |
| Interquartile 75% (IQ3) | 11.6% | 8.8% |
| Interquartile Range (IQR) | 6.2% | 4.5% |
| Standard Deviation (Sample) | 5.0% | 8.3% |
| Standard Deviation (Population) | 4.8% | 8.2% |
Similar Demographics by Unemployment Among Ages 60 to 64 years
Demographics Similar to Arapaho by Unemployment Among Ages 60 to 64 years
In terms of unemployment among ages 60 to 64 years, the demographic groups most similar to Arapaho are Navajo (6.3%, a difference of 0.48%), Tlingit-Haida (6.4%, a difference of 1.4%), Kiowa (6.2%, a difference of 1.6%), Vietnamese (6.1%, a difference of 3.5%), and Puerto Rican (6.1%, a difference of 3.7%).
| Demographics | Rating | Rank | Unemployment Among Ages 60 to 64 years |
| Yakama | 0.0 /100 | #331 | Tragic 6.0% |
| Dominicans | 0.0 /100 | #332 | Tragic 6.0% |
| Immigrants | Dominican Republic | 0.0 /100 | #333 | Tragic 6.0% |
| Puerto Ricans | 0.0 /100 | #334 | Tragic 6.1% |
| Vietnamese | 0.0 /100 | #335 | Tragic 6.1% |
| Kiowa | 0.0 /100 | #336 | Tragic 6.2% |
| Navajo | 0.0 /100 | #337 | Tragic 6.3% |
| Arapaho | 0.0 /100 | #338 | Tragic 6.3% |
| Tlingit-Haida | 0.0 /100 | #339 | Tragic 6.4% |
| Pueblo | 0.0 /100 | #340 | Tragic 6.7% |
| Yuman | 0.0 /100 | #341 | Tragic 6.8% |
| Aleuts | 0.0 /100 | #342 | Tragic 6.8% |
| Immigrants | Yemen | 0.0 /100 | #343 | Tragic 6.8% |
| Alaska Natives | 0.0 /100 | #344 | Tragic 7.6% |
| Alaskan Athabascans | 0.0 /100 | #345 | Tragic 8.4% |
Demographics Similar to Pennsylvania Germans by Unemployment Among Ages 60 to 64 years
In terms of unemployment among ages 60 to 64 years, the demographic groups most similar to Pennsylvania Germans are French Canadian (4.8%, a difference of 0.010%), Cambodian (4.8%, a difference of 0.070%), Basque (4.8%, a difference of 0.090%), Immigrants from Lithuania (4.8%, a difference of 0.090%), and Immigrants from Africa (4.8%, a difference of 0.090%).
| Demographics | Rating | Rank | Unemployment Among Ages 60 to 64 years |
| Choctaw | 90.3 /100 | #128 | Exceptional 4.8% |
| Immigrants | Serbia | 90.2 /100 | #129 | Exceptional 4.8% |
| Immigrants | Syria | 90.1 /100 | #130 | Exceptional 4.8% |
| Immigrants | Lebanon | 89.6 /100 | #131 | Excellent 4.8% |
| Lithuanians | 89.6 /100 | #132 | Excellent 4.8% |
| Yaqui | 89.5 /100 | #133 | Excellent 4.8% |
| Basques | 88.8 /100 | #134 | Excellent 4.8% |
| Pennsylvania Germans | 87.8 /100 | #135 | Excellent 4.8% |
| French Canadians | 87.6 /100 | #136 | Excellent 4.8% |
| Cambodians | 86.9 /100 | #137 | Excellent 4.8% |
| Immigrants | Lithuania | 86.7 /100 | #138 | Excellent 4.8% |
| Immigrants | Africa | 86.6 /100 | #139 | Excellent 4.8% |
| Pima | 85.8 /100 | #140 | Excellent 4.8% |
| Panamanians | 85.5 /100 | #141 | Excellent 4.8% |
| Immigrants | Ethiopia | 85.3 /100 | #142 | Excellent 4.8% |