Arapaho vs South African Unemployment Among Women with Children Under 6 years

COMPARE

Arapaho
Race
Ancestry
AfghanAfricanAlaska NativeAlaskan AthabascanAlbanianAleutAlsatianAmericanApacheArabArapahoArgentineanArmenianAssyrian/Chaldean/SyriacAustralianAustrianBahamianBangladeshiBarbadianBasqueBelgianBelizeanBermudanBhutaneseBlackfeetBolivianBrazilianBritishBritish West IndianBulgarianBurmeseCajunCambodianCanadianCape VerdeanCarpatho RusynCelticCentral AmericanCentral American IndianCherokeeCheyenneChickasawChileanChineseChippewaChoctawColombianColvilleComancheCosta RicanCreeCreekCroatianCrowCubanCypriotCzechCzechoslovakianDanishDelawareDominicanDutchDutch West IndianEastern EuropeanEcuadorianEgyptianEnglishEstonianEthiopianEuropeanFijianFilipinoFinnishFrenchFrench American IndianFrench CanadianGermanGerman RussianGhanaianGreekGuamanian/ChamorroGuatemalanGuyaneseHaitianHmongHonduranHopiHoumaHungarianIcelanderIndian (Asian)IndonesianInupiatIranianIraqiIrishIroquoisIsraeliItalianJamaicanJapaneseJordanianKenyanKiowaKoreanLaotianLatvianLebaneseLiberianLithuanianLumbeeLuxembourgerMacedonianMalaysianMalteseMarshalleseMenomineeMexicanMexican American IndianMongolianMoroccanNative HawaiianNavajoNepaleseNew ZealanderNicaraguanNigerianNorthern EuropeanNorwegianOkinawanOsageOttawaPaiutePakistaniPalestinianPanamanianParaguayanPennsylvania GermanPeruvianPimaPolishPortuguesePotawatomiPuebloPuerto RicanPuget Sound SalishRomanianRussianSalvadoranSamoanScandinavianScotch-IrishScottishSeminoleSenegaleseSerbianShoshoneSierra LeoneanSiouxSlavicSlovakSloveneSomaliSouth AmericanSouth American IndianSoviet UnionSpaniardSpanishSpanish AmericanSpanish American IndianSri LankanSubsaharan AfricanSudaneseSwedishSwissSyrianTaiwaneseThaiTlingit-HaidaTohono O'OdhamTonganTrinidadian and TobagonianTsimshianTurkishU.S. Virgin IslanderUgandanUkrainianUruguayanUteVenezuelanVietnameseWelshWest IndianYakamaYaquiYugoslavianYumanYup'ikZimbabwean
Immigration
NonimmigrantsImmigrantsAfghanistanAfricaAlbaniaArgentinaArmeniaAsiaAustraliaAustriaBahamasBangladeshBarbadosBelarusBelgiumBelizeBoliviaBosnia and HerzegovinaBrazilBulgariaBurma/MyanmarCabo VerdeCambodiaCameroonCanadaCaribbeanCentral AmericaChileChinaColombiaCongoCosta RicaCroatiaCubaCzechoslovakiaDenmarkDominicaDominican RepublicEastern AfricaEastern AsiaEastern EuropeEcuadorEgyptEl SalvadorEnglandEritreaEthiopiaEuropeFijiFranceGermanyGhanaGreeceGrenadaGuatemalaGuyanaHaitiHondurasHong KongHungaryIndiaIndonesiaIranIraqIrelandIsraelItalyJamaicaJapanJordanKazakhstanKenyaKoreaKuwaitLaosLatin AmericaLatviaLebanonLiberiaLithuaniaMalaysiaMexicoMicronesiaMiddle AfricaMoldovaMoroccoNepalNetherlandsNicaraguaNigeriaNorth AmericaNorth MacedoniaNorthern AfricaNorthern EuropeNorwayOceaniaPakistanPanamaPeruPhilippinesPolandPortugalRomaniaRussiaSaudi ArabiaScotlandSenegalSerbiaSierra LeoneSingaporeSomaliaSouth AfricaSouth AmericaSouth Central AsiaSouth Eastern AsiaSouthern EuropeSpainSri LankaSt. Vincent and the GrenadinesSudanSwedenSwitzerlandSyriaTaiwanThailandTrinidad and TobagoTurkeyUgandaUkraineUruguayUzbekistanVenezuelaVietnamWest IndiesWestern AfricaWestern AsiaWestern EuropeYemenZaireZimbabweAzores
South African
Race
Ancestry
AfghanAfricanAlaska NativeAlaskan AthabascanAlbanianAleutAlsatianAmericanApacheArabArgentineanArmenianAssyrian/Chaldean/SyriacAustralianAustrianBahamianBangladeshiBarbadianBasqueBelgianBelizeanBermudanBhutaneseBlackfeetBolivianBrazilianBritishBritish West IndianBulgarianBurmeseCajunCambodianCanadianCape VerdeanCarpatho RusynCelticCentral AmericanCentral American IndianCherokeeCheyenneChickasawChileanChineseChippewaChoctawColombianColvilleComancheCosta RicanCreeCreekCroatianCrowCubanCypriotCzechCzechoslovakianDanishDelawareDominicanDutchDutch West IndianEastern EuropeanEcuadorianEgyptianEnglishEstonianEthiopianEuropeanFijianFilipinoFinnishFrenchFrench American IndianFrench CanadianGermanGerman RussianGhanaianGreekGuamanian/ChamorroGuatemalanGuyaneseHaitianHmongHonduranHopiHoumaHungarianIcelanderIndian (Asian)IndonesianInupiatIranianIraqiIrishIroquoisIsraeliItalianJamaicanJapaneseJordanianKenyanKiowaKoreanLaotianLatvianLebaneseLiberianLithuanianLumbeeLuxembourgerMacedonianMalaysianMalteseMarshalleseMenomineeMexicanMexican American IndianMongolianMoroccanNative HawaiianNavajoNepaleseNew ZealanderNicaraguanNigerianNorthern EuropeanNorwegianOkinawanOsageOttawaPaiutePakistaniPalestinianPanamanianParaguayanPennsylvania GermanPeruvianPimaPolishPortuguesePotawatomiPuebloPuerto RicanPuget Sound SalishRomanianRussianSalvadoranSamoanScandinavianScotch-IrishScottishSeminoleSenegaleseSerbianShoshoneSierra LeoneanSiouxSlavicSlovakSloveneSomaliSouth AfricanSouth AmericanSouth American IndianSoviet UnionSpaniardSpanishSpanish AmericanSpanish American IndianSri LankanSubsaharan AfricanSudaneseSwedishSwissSyrianTaiwaneseThaiTlingit-HaidaTohono O'OdhamTonganTrinidadian and TobagonianTsimshianTurkishU.S. Virgin IslanderUgandanUkrainianUruguayanUteVenezuelanVietnameseWelshWest IndianYakamaYaquiYugoslavianYumanYup'ikZimbabwean
Immigration
NonimmigrantsImmigrantsAfghanistanAfricaAlbaniaArgentinaArmeniaAsiaAustraliaAustriaBahamasBangladeshBarbadosBelarusBelgiumBelizeBoliviaBosnia and HerzegovinaBrazilBulgariaBurma/MyanmarCabo VerdeCambodiaCameroonCanadaCaribbeanCentral AmericaChileChinaColombiaCongoCosta RicaCroatiaCubaCzechoslovakiaDenmarkDominicaDominican RepublicEastern AfricaEastern AsiaEastern EuropeEcuadorEgyptEl SalvadorEnglandEritreaEthiopiaEuropeFijiFranceGermanyGhanaGreeceGrenadaGuatemalaGuyanaHaitiHondurasHong KongHungaryIndiaIndonesiaIranIraqIrelandIsraelItalyJamaicaJapanJordanKazakhstanKenyaKoreaKuwaitLaosLatin AmericaLatviaLebanonLiberiaLithuaniaMalaysiaMexicoMicronesiaMiddle AfricaMoldovaMoroccoNepalNetherlandsNicaraguaNigeriaNorth AmericaNorth MacedoniaNorthern AfricaNorthern EuropeNorwayOceaniaPakistanPanamaPeruPhilippinesPolandPortugalRomaniaRussiaSaudi ArabiaScotlandSenegalSerbiaSierra LeoneSingaporeSomaliaSouth AfricaSouth AmericaSouth Central AsiaSouth Eastern AsiaSouthern EuropeSpainSri LankaSt. Vincent and the GrenadinesSudanSwedenSwitzerlandSyriaTaiwanThailandTrinidad and TobagoTurkeyUgandaUkraineUruguayUzbekistanVenezuelaVietnamWest IndiesWestern AfricaWestern AsiaWestern EuropeYemenZaireZimbabweAzores
Unemployment Among Women with Children Under 6 years
Income
Poverty
Unemployment
Labor Participation
Family Structure
Vehicle Availability
Education Level
Disability

Unemployment Among Women with Children Under 6 years Comparison

Arapaho

South Africans

Tragic
Exceptional
19.0%
UNEMPLOYMENT AMONG WOMEN WITH CHILDREN UNDER 6 YEARS
0.0/ 100
METRIC RATING
346th/ 347
METRIC RANK
7.3%
UNEMPLOYMENT AMONG WOMEN WITH CHILDREN UNDER 6 YEARS
94.1/ 100
METRIC RATING
119th/ 347
METRIC RANK

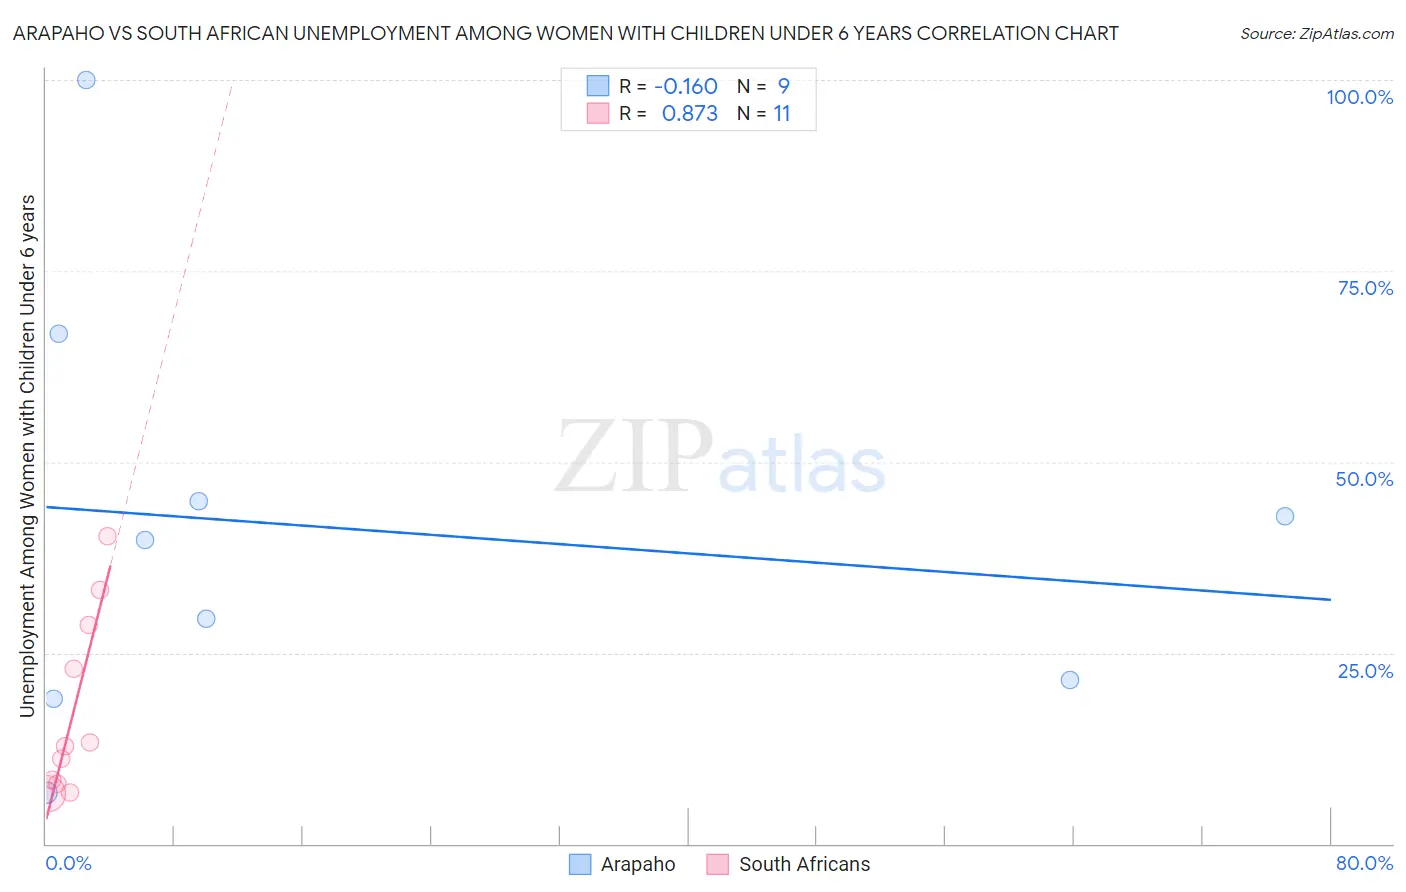
Arapaho vs South African Unemployment Among Women with Children Under 6 years Correlation Chart

The statistical analysis conducted on geographies consisting of 26,873,708 people shows a poor negative correlation between the proportion of Arapaho and unemployment rate among women with children under the age of 6 in the United States with a correlation coefficient (R) of -0.160 and weighted average of 19.0%. Similarly, the statistical analysis conducted on geographies consisting of 153,714,880 people shows a very strong positive correlation between the proportion of South Africans and unemployment rate among women with children under the age of 6 in the United States with a correlation coefficient (R) of 0.873 and weighted average of 7.3%, a difference of 160.9%.
Arapaho vs South African Unemployment Among Women with Children Under 6 years

Unemployment Among Women with Children Under 6 years Correlation Summary

MeasurementArapahoSouth African
Minimum6.7%6.6%
Maximum100.0%40.3%
Range93.3%33.7%
Mean41.2%17.4%
Median39.8%12.8%
Interquartile 25% (IQ1)20.2%7.9%
Interquartile 75% (IQ3)55.8%28.7%
Interquartile Range (IQR)35.6%20.8%
Standard Deviation (Sample)28.1%11.9%
Standard Deviation (Population)26.5%11.3%

Similar Demographics by Unemployment Among Women with Children Under 6 years

Demographics Similar to Arapaho by Unemployment Among Women with Children Under 6 years

In terms of unemployment among women with children under 6 years, the demographic groups most similar to Arapaho are Inupiat (17.7%, a difference of 7.5%), Yup'ik (21.1%, a difference of 10.6%), Hopi (16.8%, a difference of 13.5%), Crow (14.6%, a difference of 30.0%), and Yuman (14.6%, a difference of 30.1%).
DemographicsRating | RankUnemployment Among Women with Children Under 6 years
Natives/Alaskans
0.0
/100
|
#333
Tragic
11.5%
Apache
0.0
/100
|
#334
Tragic
12.3%
Puerto Ricans
0.0
/100
|
#335
Tragic
12.5%
Shoshone
0.0
/100
|
#336
Tragic
13.2%
Chippewa
0.0
/100
|
#337
Tragic
13.3%
Pima
0.0
/100
|
#338
Tragic
13.4%
Navajo
0.0
/100
|
#339
Tragic
13.5%
Immigrants | Yemen
0.0
/100
|
#340
Tragic
13.5%
Lumbee
0.0
/100
|
#341
Tragic
13.8%
Yuman
0.0
/100
|
#342
Tragic
14.6%
Crow
0.0
/100
|
#343
Tragic
14.6%
Hopi
0.0
/100
|
#344
Tragic
16.8%
Inupiat
0.0
/100
|
#345
Tragic
17.7%
Arapaho
0.0
/100
|
#346
Tragic
19.0%
Yup'ik
0.0
/100
|
#347
Tragic
21.1%

Demographics Similar to South Africans by Unemployment Among Women with Children Under 6 years

In terms of unemployment among women with children under 6 years, the demographic groups most similar to South Africans are Iraqi (7.3%, a difference of 0.070%), Serbian (7.3%, a difference of 0.11%), Immigrants from Chile (7.3%, a difference of 0.19%), Immigrants from Bosnia and Herzegovina (7.3%, a difference of 0.20%), and Immigrants from Zaire (7.3%, a difference of 0.25%).
DemographicsRating | RankUnemployment Among Women with Children Under 6 years
Israelis
96.5
/100
|
#112
Exceptional
7.2%
Nicaraguans
96.3
/100
|
#113
Exceptional
7.2%
Argentineans
96.2
/100
|
#114
Exceptional
7.2%
Immigrants | Italy
96.1
/100
|
#115
Exceptional
7.2%
Armenians
95.9
/100
|
#116
Exceptional
7.2%
Immigrants | Kenya
95.4
/100
|
#117
Exceptional
7.3%
Serbians
94.5
/100
|
#118
Exceptional
7.3%
South Africans
94.1
/100
|
#119
Exceptional
7.3%
Iraqis
93.9
/100
|
#120
Exceptional
7.3%
Immigrants | Chile
93.5
/100
|
#121
Exceptional
7.3%
Immigrants | Bosnia and Herzegovina
93.5
/100
|
#122
Exceptional
7.3%
Immigrants | Zaire
93.3
/100
|
#123
Exceptional
7.3%
Immigrants | South Africa
92.5
/100
|
#124
Exceptional
7.3%
Pakistanis
92.2
/100
|
#125
Exceptional
7.3%
Immigrants | Burma/Myanmar
91.9
/100
|
#126
Exceptional
7.3%