Arapaho vs British Unemployment Among Women with Children Ages 6 to 17 years
COMPARE
Arapaho
British
Unemployment Among Women with Children Ages 6 to 17 years
Unemployment Among Women with Children Ages 6 to 17 years Comparison
Arapaho
British
16.8%
UNEMPLOYMENT AMONG WOMEN WITH CHILDREN AGES 6 TO 17 YEARS
0.0/ 100
METRIC RATING
345th/ 347
METRIC RANK
8.9%
UNEMPLOYMENT AMONG WOMEN WITH CHILDREN AGES 6 TO 17 YEARS
55.2/ 100
METRIC RATING
169th/ 347
METRIC RANK
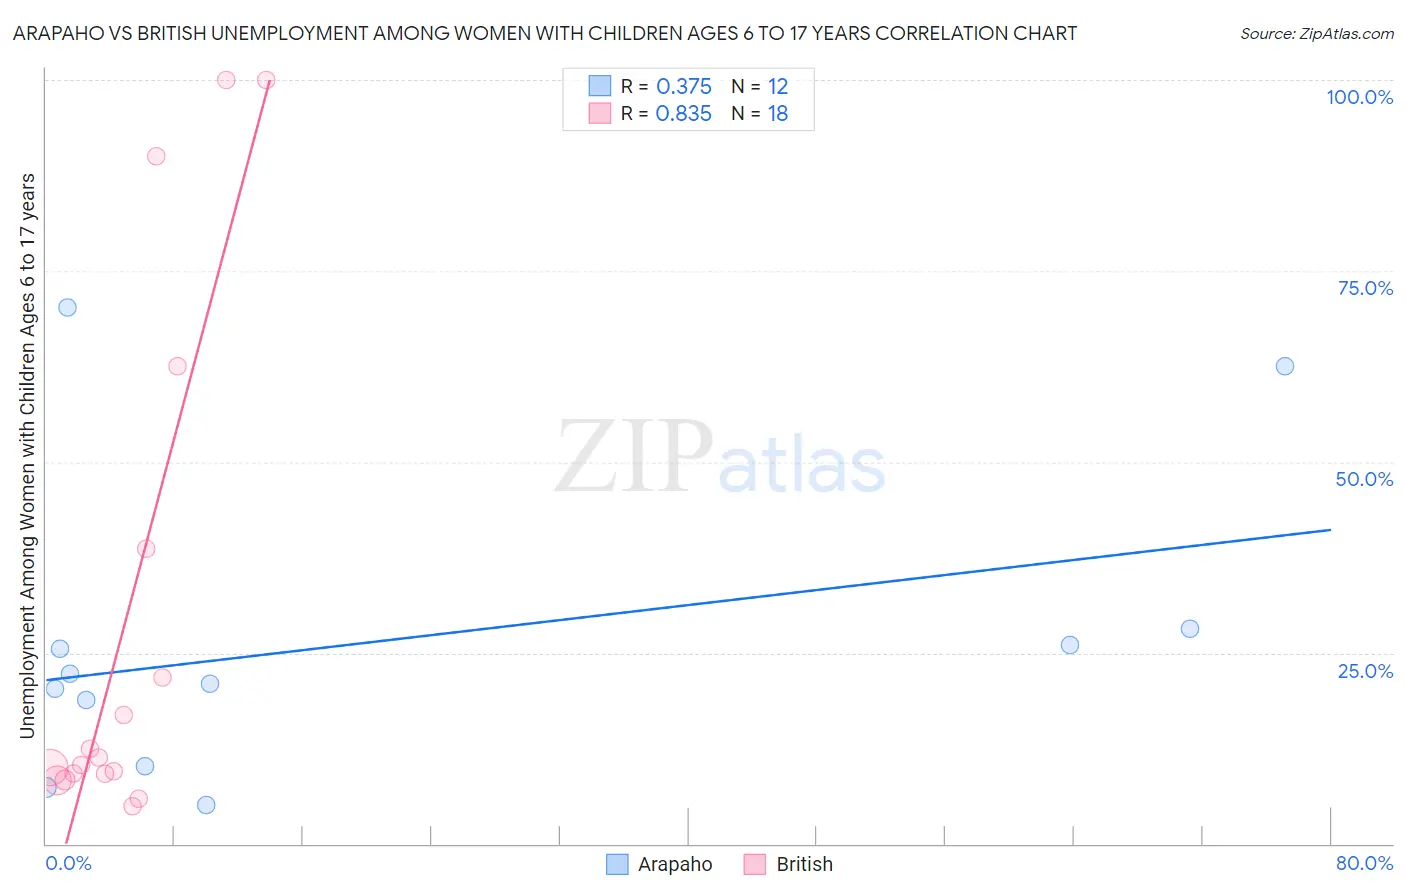
Arapaho vs British Unemployment Among Women with Children Ages 6 to 17 years Correlation Chart
The statistical analysis conducted on geographies consisting of 26,790,492 people shows a mild positive correlation between the proportion of Arapaho and unemployment rate among women with children between the ages 6 and 17 in the United States with a correlation coefficient (R) of 0.375 and weighted average of 16.8%. Similarly, the statistical analysis conducted on geographies consisting of 343,173,171 people shows a very strong positive correlation between the proportion of British and unemployment rate among women with children between the ages 6 and 17 in the United States with a correlation coefficient (R) of 0.835 and weighted average of 8.9%, a difference of 88.4%.
Unemployment Among Women with Children Ages 6 to 17 years Correlation Summary
| Measurement | Arapaho | British |
| Minimum | 5.0% | 4.9% |
| Maximum | 70.2% | 100.0% |
| Range | 65.2% | 95.1% |
| Mean | 26.4% | 29.4% |
| Median | 21.5% | 10.7% |
| Interquartile 25% (IQ1) | 14.5% | 9.1% |
| Interquartile 75% (IQ3) | 27.1% | 38.6% |
| Interquartile Range (IQR) | 12.6% | 29.5% |
| Standard Deviation (Sample) | 20.1% | 34.0% |
| Standard Deviation (Population) | 19.3% | 33.1% |
Similar Demographics by Unemployment Among Women with Children Ages 6 to 17 years
Demographics Similar to Arapaho by Unemployment Among Women with Children Ages 6 to 17 years
In terms of unemployment among women with children ages 6 to 17 years, the demographic groups most similar to Arapaho are Cheyenne (16.4%, a difference of 2.9%), Yup'ik (18.6%, a difference of 10.4%), Pima (18.9%, a difference of 12.0%), Inupiat (14.9%, a difference of 13.5%), and Yuman (14.8%, a difference of 13.8%).
| Demographics | Rating | Rank | Unemployment Among Women with Children Ages 6 to 17 years |
| Natives/Alaskans | 0.0 /100 | #333 | Tragic 11.5% |
| Ugandans | 0.0 /100 | #334 | Tragic 12.0% |
| Colville | 0.0 /100 | #335 | Tragic 12.3% |
| Houma | 0.0 /100 | #336 | Tragic 12.5% |
| Immigrants | Yemen | 0.0 /100 | #337 | Tragic 12.7% |
| Hopi | 0.0 /100 | #338 | Tragic 12.9% |
| Sioux | 0.0 /100 | #339 | Tragic 13.2% |
| Puerto Ricans | 0.0 /100 | #340 | Tragic 13.9% |
| Navajo | 0.0 /100 | #341 | Tragic 14.2% |
| Yuman | 0.0 /100 | #342 | Tragic 14.8% |
| Inupiat | 0.0 /100 | #343 | Tragic 14.9% |
| Cheyenne | 0.0 /100 | #344 | Tragic 16.4% |
| Arapaho | 0.0 /100 | #345 | Tragic 16.8% |
| Yup'ik | 0.0 /100 | #346 | Tragic 18.6% |
| Pima | 0.0 /100 | #347 | Tragic 18.9% |
Demographics Similar to British by Unemployment Among Women with Children Ages 6 to 17 years
In terms of unemployment among women with children ages 6 to 17 years, the demographic groups most similar to British are Turkish (8.9%, a difference of 0.050%), Immigrants from Croatia (8.9%, a difference of 0.080%), Immigrants from England (8.9%, a difference of 0.11%), Moroccan (8.9%, a difference of 0.14%), and Jordanian (9.0%, a difference of 0.14%).
| Demographics | Rating | Rank | Unemployment Among Women with Children Ages 6 to 17 years |
| Immigrants | Netherlands | 60.8 /100 | #162 | Good 8.9% |
| Mexican American Indians | 60.6 /100 | #163 | Good 8.9% |
| Ukrainians | 59.7 /100 | #164 | Average 8.9% |
| Immigrants | Micronesia | 59.2 /100 | #165 | Average 8.9% |
| Moroccans | 58.3 /100 | #166 | Average 8.9% |
| Immigrants | England | 57.7 /100 | #167 | Average 8.9% |
| Immigrants | Croatia | 57.1 /100 | #168 | Average 8.9% |
| British | 55.2 /100 | #169 | Average 8.9% |
| Turks | 54.1 /100 | #170 | Average 8.9% |
| Jordanians | 52.2 /100 | #171 | Average 9.0% |
| Immigrants | West Indies | 52.2 /100 | #172 | Average 9.0% |
| Immigrants | Brazil | 51.0 /100 | #173 | Average 9.0% |
| Immigrants | Costa Rica | 50.0 /100 | #174 | Average 9.0% |
| Immigrants | Sierra Leone | 45.9 /100 | #175 | Average 9.0% |
| Immigrants | Italy | 43.7 /100 | #176 | Average 9.0% |