Iraqi vs Navajo Unemployment Among Youth under 25 years
COMPARE
Iraqi
Navajo
Unemployment Among Youth under 25 years
Unemployment Among Youth under 25 years Comparison
Iraqis
Navajo
11.5%
UNEMPLOYMENT AMONG YOUTH UNDER 25 YEARS
68.3/ 100
METRIC RATING
152nd/ 347
METRIC RANK
18.6%
UNEMPLOYMENT AMONG YOUTH UNDER 25 YEARS
0.0/ 100
METRIC RATING
343rd/ 347
METRIC RANK
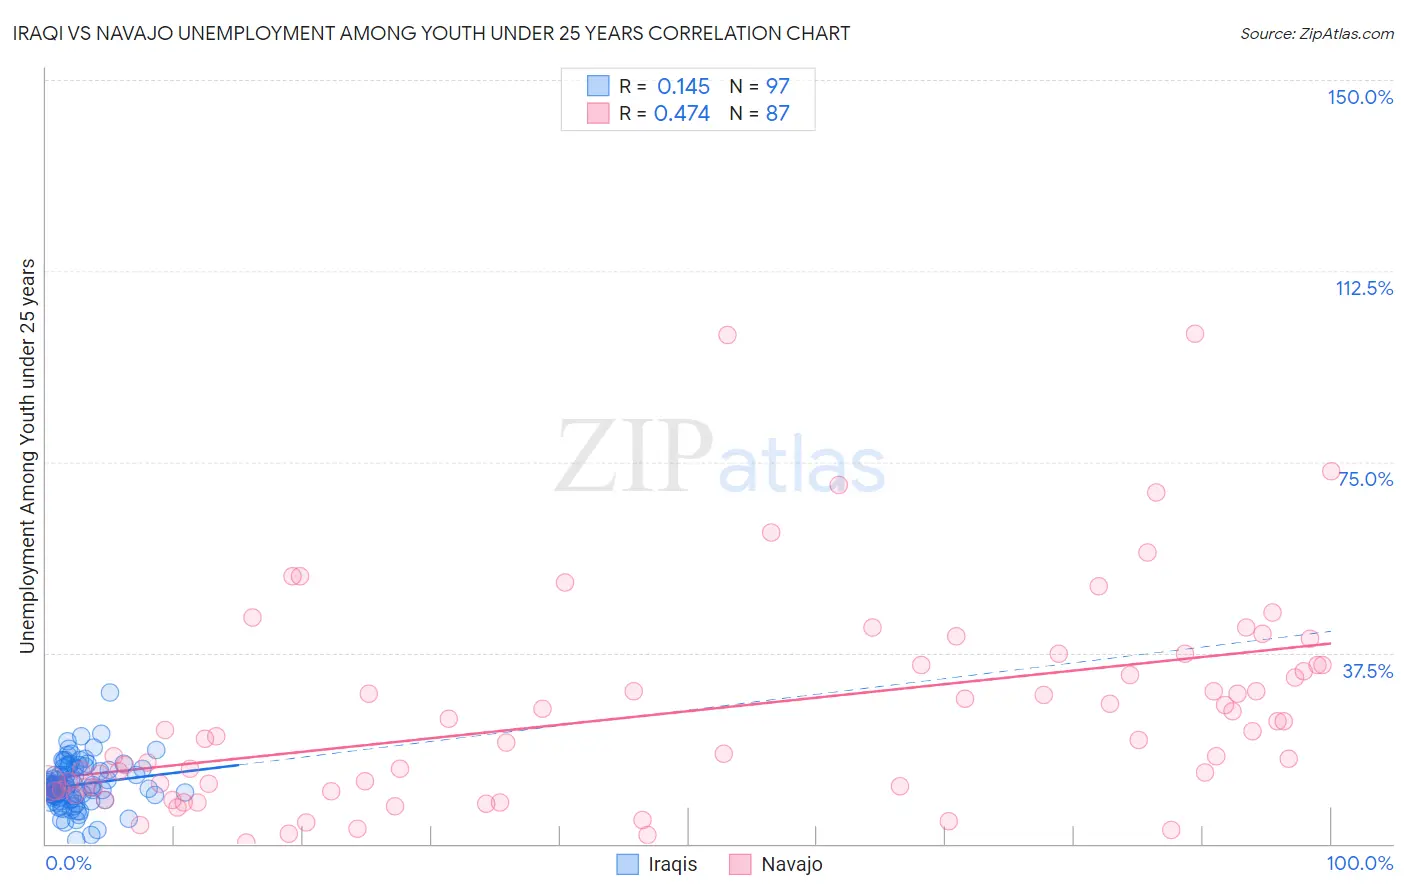
Iraqi vs Navajo Unemployment Among Youth under 25 years Correlation Chart
The statistical analysis conducted on geographies consisting of 170,162,065 people shows a poor positive correlation between the proportion of Iraqis and unemployment rate among youth under the age of 25 in the United States with a correlation coefficient (R) of 0.145 and weighted average of 11.5%. Similarly, the statistical analysis conducted on geographies consisting of 223,013,083 people shows a moderate positive correlation between the proportion of Navajo and unemployment rate among youth under the age of 25 in the United States with a correlation coefficient (R) of 0.474 and weighted average of 18.6%, a difference of 61.7%.
Unemployment Among Youth under 25 years Correlation Summary
| Measurement | Iraqi | Navajo |
| Minimum | 0.80% | 0.30% |
| Maximum | 29.7% | 100.1% |
| Range | 28.9% | 99.8% |
| Mean | 11.6% | 25.7% |
| Median | 11.1% | 20.7% |
| Interquartile 25% (IQ1) | 9.1% | 11.1% |
| Interquartile 75% (IQ3) | 14.6% | 35.1% |
| Interquartile Range (IQR) | 5.5% | 24.0% |
| Standard Deviation (Sample) | 4.5% | 20.5% |
| Standard Deviation (Population) | 4.5% | 20.4% |
Similar Demographics by Unemployment Among Youth under 25 years
Demographics Similar to Iraqis by Unemployment Among Youth under 25 years
In terms of unemployment among youth under 25 years, the demographic groups most similar to Iraqis are Immigrants from Czechoslovakia (11.5%, a difference of 0.060%), Immigrants from Asia (11.5%, a difference of 0.070%), Immigrants from Romania (11.5%, a difference of 0.090%), Uruguayan (11.5%, a difference of 0.10%), and Immigrants from Germany (11.5%, a difference of 0.11%).
| Demographics | Rating | Rank | Unemployment Among Youth under 25 years |
| Argentineans | 73.0 /100 | #145 | Good 11.5% |
| Brazilians | 72.5 /100 | #146 | Good 11.5% |
| Laotians | 72.4 /100 | #147 | Good 11.5% |
| Immigrants | Northern Europe | 72.1 /100 | #148 | Good 11.5% |
| Immigrants | Cambodia | 71.8 /100 | #149 | Good 11.5% |
| Immigrants | Switzerland | 71.6 /100 | #150 | Good 11.5% |
| Uruguayans | 70.4 /100 | #151 | Good 11.5% |
| Iraqis | 68.3 /100 | #152 | Good 11.5% |
| Immigrants | Czechoslovakia | 67.1 /100 | #153 | Good 11.5% |
| Immigrants | Asia | 66.7 /100 | #154 | Good 11.5% |
| Immigrants | Romania | 66.3 /100 | #155 | Good 11.5% |
| Immigrants | Germany | 65.9 /100 | #156 | Good 11.5% |
| Indians (Asian) | 65.1 /100 | #157 | Good 11.5% |
| Immigrants | Turkey | 64.8 /100 | #158 | Good 11.5% |
| Immigrants | Western Europe | 64.7 /100 | #159 | Good 11.5% |
Demographics Similar to Navajo by Unemployment Among Youth under 25 years
In terms of unemployment among youth under 25 years, the demographic groups most similar to Navajo are Puerto Rican (18.4%, a difference of 1.2%), Paiute (17.6%, a difference of 6.0%), Crow (20.1%, a difference of 7.8%), Colville (16.8%, a difference of 11.1%), and Tsimshian (16.5%, a difference of 13.0%).
| Demographics | Rating | Rank | Unemployment Among Youth under 25 years |
| Guyanese | 0.0 /100 | #333 | Tragic 15.9% |
| Immigrants | Guyana | 0.0 /100 | #334 | Tragic 15.9% |
| Immigrants | St. Vincent and the Grenadines | 0.0 /100 | #335 | Tragic 16.1% |
| Pima | 0.0 /100 | #336 | Tragic 16.2% |
| Arapaho | 0.0 /100 | #337 | Tragic 16.3% |
| Yuman | 0.0 /100 | #338 | Tragic 16.3% |
| Tsimshian | 0.0 /100 | #339 | Tragic 16.5% |
| Colville | 0.0 /100 | #340 | Tragic 16.8% |
| Paiute | 0.0 /100 | #341 | Tragic 17.6% |
| Puerto Ricans | 0.0 /100 | #342 | Tragic 18.4% |
| Navajo | 0.0 /100 | #343 | Tragic 18.6% |
| Crow | 0.0 /100 | #344 | Tragic 20.1% |
| Hopi | 0.0 /100 | #345 | Tragic 21.5% |
| Inupiat | 0.0 /100 | #346 | Tragic 22.0% |
| Yup'ik | 0.0 /100 | #347 | Tragic 23.7% |