Alaska Native vs Navajo Unemployment Among Youth under 25 years
COMPARE
Alaska Native
Navajo
Unemployment Among Youth under 25 years
Unemployment Among Youth under 25 years Comparison
Alaska Natives
Navajo
14.9%
UNEMPLOYMENT AMONG YOUTH UNDER 25 YEARS
0.0/ 100
METRIC RATING
325th/ 347
METRIC RANK
18.6%
UNEMPLOYMENT AMONG YOUTH UNDER 25 YEARS
0.0/ 100
METRIC RATING
343rd/ 347
METRIC RANK
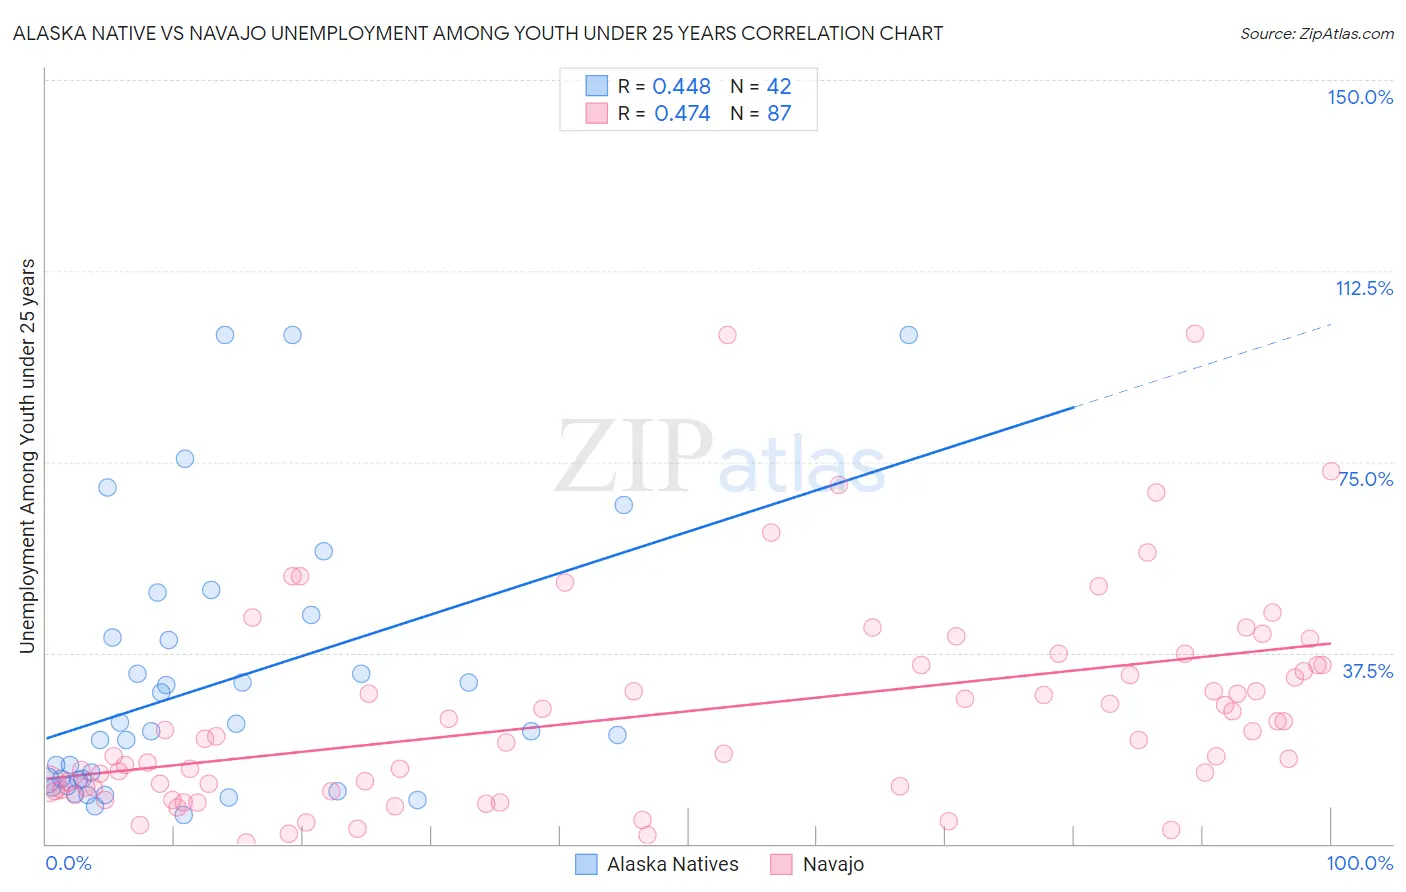
Alaska Native vs Navajo Unemployment Among Youth under 25 years Correlation Chart
The statistical analysis conducted on geographies consisting of 76,575,345 people shows a moderate positive correlation between the proportion of Alaska Natives and unemployment rate among youth under the age of 25 in the United States with a correlation coefficient (R) of 0.448 and weighted average of 14.9%. Similarly, the statistical analysis conducted on geographies consisting of 223,013,083 people shows a moderate positive correlation between the proportion of Navajo and unemployment rate among youth under the age of 25 in the United States with a correlation coefficient (R) of 0.474 and weighted average of 18.6%, a difference of 24.9%.
Unemployment Among Youth under 25 years Correlation Summary
| Measurement | Alaska Native | Navajo |
| Minimum | 5.6% | 0.30% |
| Maximum | 100.0% | 100.1% |
| Range | 94.4% | 99.8% |
| Mean | 31.6% | 25.7% |
| Median | 22.2% | 20.7% |
| Interquartile 25% (IQ1) | 12.5% | 11.1% |
| Interquartile 75% (IQ3) | 40.4% | 35.1% |
| Interquartile Range (IQR) | 28.0% | 24.0% |
| Standard Deviation (Sample) | 26.3% | 20.5% |
| Standard Deviation (Population) | 25.9% | 20.4% |
Demographics Similar to Alaska Natives and Navajo by Unemployment Among Youth under 25 years
In terms of unemployment among youth under 25 years, the demographic groups most similar to Alaska Natives are Immigrants from Jamaica (14.8%, a difference of 0.67%), Immigrants from Barbados (15.2%, a difference of 2.2%), British West Indian (15.5%, a difference of 4.3%), Immigrants from Dominican Republic (15.6%, a difference of 4.4%), and Immigrants from Yemen (15.6%, a difference of 4.5%). Similarly, the demographic groups most similar to Navajo are Puerto Rican (18.4%, a difference of 1.2%), Paiute (17.6%, a difference of 6.0%), Crow (20.1%, a difference of 7.8%), Colville (16.8%, a difference of 11.1%), and Tsimshian (16.5%, a difference of 13.0%).
| Demographics | Rating | Rank | Unemployment Among Youth under 25 years |
| Immigrants | Jamaica | 0.0 /100 | #324 | Tragic 14.8% |
| Alaska Natives | 0.0 /100 | #325 | Tragic 14.9% |
| Immigrants | Barbados | 0.0 /100 | #326 | Tragic 15.2% |
| British West Indians | 0.0 /100 | #327 | Tragic 15.5% |
| Immigrants | Dominican Republic | 0.0 /100 | #328 | Tragic 15.6% |
| Immigrants | Yemen | 0.0 /100 | #329 | Tragic 15.6% |
| Yakama | 0.0 /100 | #330 | Tragic 15.6% |
| Dominicans | 0.0 /100 | #331 | Tragic 15.7% |
| Immigrants | Grenada | 0.0 /100 | #332 | Tragic 15.8% |
| Guyanese | 0.0 /100 | #333 | Tragic 15.9% |
| Immigrants | Guyana | 0.0 /100 | #334 | Tragic 15.9% |
| Immigrants | St. Vincent and the Grenadines | 0.0 /100 | #335 | Tragic 16.1% |
| Pima | 0.0 /100 | #336 | Tragic 16.2% |
| Arapaho | 0.0 /100 | #337 | Tragic 16.3% |
| Yuman | 0.0 /100 | #338 | Tragic 16.3% |
| Tsimshian | 0.0 /100 | #339 | Tragic 16.5% |
| Colville | 0.0 /100 | #340 | Tragic 16.8% |
| Paiute | 0.0 /100 | #341 | Tragic 17.6% |
| Puerto Ricans | 0.0 /100 | #342 | Tragic 18.4% |
| Navajo | 0.0 /100 | #343 | Tragic 18.6% |
| Crow | 0.0 /100 | #344 | Tragic 20.1% |