Apache vs Laotian Unemployment Among Women with Children Ages 6 to 17 years
COMPARE
Apache
Laotian
Unemployment Among Women with Children Ages 6 to 17 years
Unemployment Among Women with Children Ages 6 to 17 years Comparison
Apache
Laotians
10.7%
UNEMPLOYMENT AMONG WOMEN WITH CHILDREN AGES 6 TO 17 YEARS
0.0/ 100
METRIC RATING
320th/ 347
METRIC RANK
7.9%
UNEMPLOYMENT AMONG WOMEN WITH CHILDREN AGES 6 TO 17 YEARS
100.0/ 100
METRIC RATING
31st/ 347
METRIC RANK
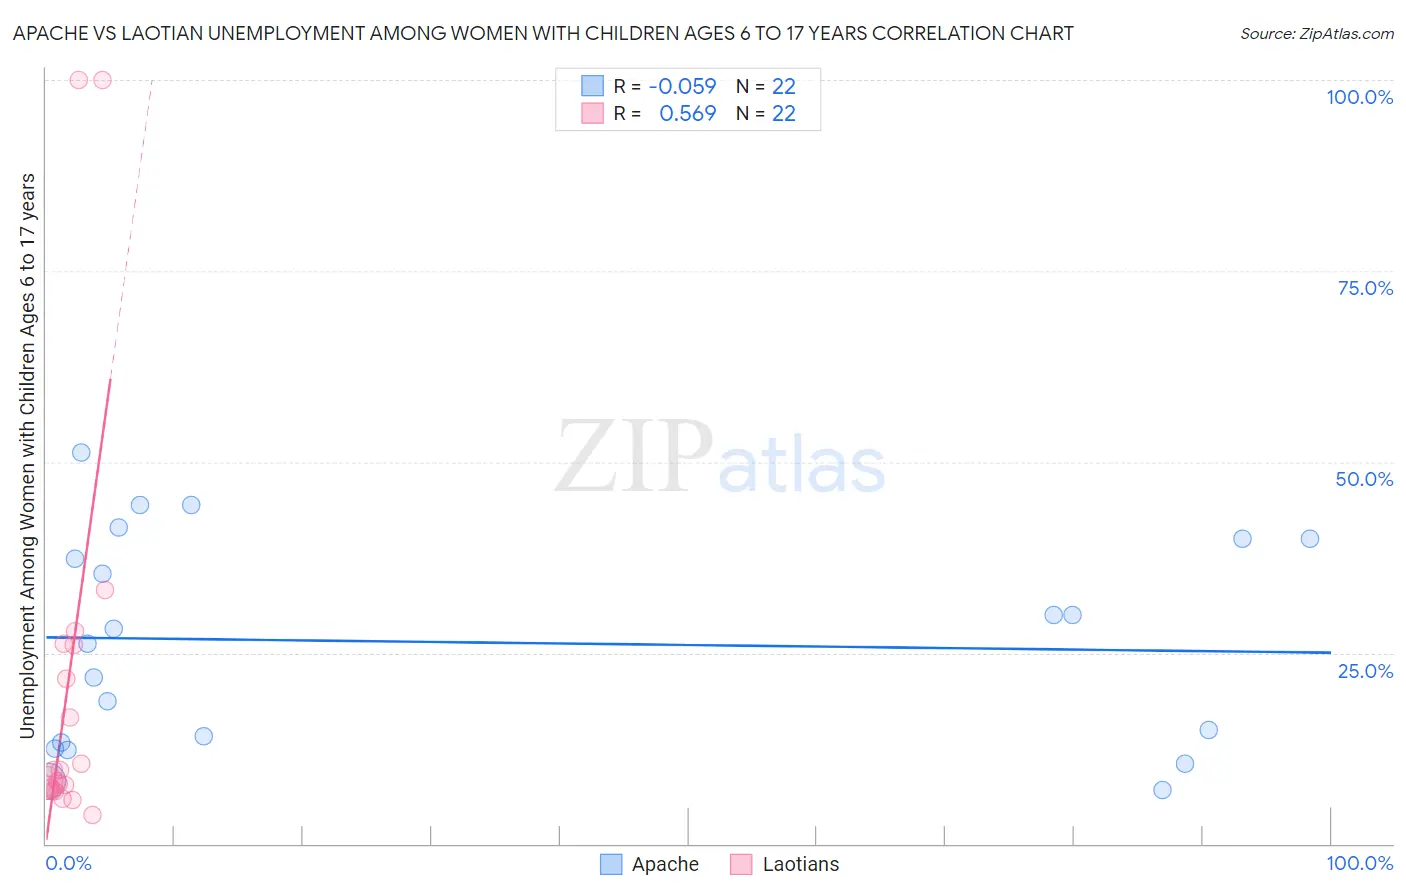
Apache vs Laotian Unemployment Among Women with Children Ages 6 to 17 years Correlation Chart
The statistical analysis conducted on geographies consisting of 185,469,454 people shows a slight negative correlation between the proportion of Apache and unemployment rate among women with children between the ages 6 and 17 in the United States with a correlation coefficient (R) of -0.059 and weighted average of 10.7%. Similarly, the statistical analysis conducted on geographies consisting of 181,430,128 people shows a substantial positive correlation between the proportion of Laotians and unemployment rate among women with children between the ages 6 and 17 in the United States with a correlation coefficient (R) of 0.569 and weighted average of 7.9%, a difference of 34.7%.
Unemployment Among Women with Children Ages 6 to 17 years Correlation Summary
| Measurement | Apache | Laotian |
| Minimum | 7.0% | 3.7% |
| Maximum | 51.1% | 100.0% |
| Range | 44.1% | 96.3% |
| Mean | 26.4% | 20.8% |
| Median | 27.2% | 8.9% |
| Interquartile 25% (IQ1) | 13.2% | 7.2% |
| Interquartile 75% (IQ3) | 40.0% | 26.1% |
| Interquartile Range (IQR) | 26.8% | 18.9% |
| Standard Deviation (Sample) | 13.8% | 27.0% |
| Standard Deviation (Population) | 13.5% | 26.4% |
Similar Demographics by Unemployment Among Women with Children Ages 6 to 17 years
Demographics Similar to Apache by Unemployment Among Women with Children Ages 6 to 17 years
In terms of unemployment among women with children ages 6 to 17 years, the demographic groups most similar to Apache are Immigrants from Uganda (10.7%, a difference of 0.020%), Tohono O'odham (10.7%, a difference of 0.17%), Delaware (10.5%, a difference of 1.3%), Bermudan (10.5%, a difference of 1.3%), and Immigrants from Dominica (10.5%, a difference of 1.5%).
| Demographics | Rating | Rank | Unemployment Among Women with Children Ages 6 to 17 years |
| Americans | 0.0 /100 | #313 | Tragic 10.4% |
| Immigrants | Cabo Verde | 0.0 /100 | #314 | Tragic 10.4% |
| Bahamians | 0.0 /100 | #315 | Tragic 10.4% |
| Immigrants | Dominica | 0.0 /100 | #316 | Tragic 10.5% |
| Bermudans | 0.0 /100 | #317 | Tragic 10.5% |
| Delaware | 0.0 /100 | #318 | Tragic 10.5% |
| Immigrants | Uganda | 0.0 /100 | #319 | Tragic 10.7% |
| Apache | 0.0 /100 | #320 | Tragic 10.7% |
| Tohono O'odham | 0.0 /100 | #321 | Tragic 10.7% |
| Cree | 0.0 /100 | #322 | Tragic 10.8% |
| Dominicans | 0.0 /100 | #323 | Tragic 10.8% |
| Immigrants | Dominican Republic | 0.0 /100 | #324 | Tragic 10.8% |
| Cajuns | 0.0 /100 | #325 | Tragic 10.8% |
| Liberians | 0.0 /100 | #326 | Tragic 10.8% |
| Cape Verdeans | 0.0 /100 | #327 | Tragic 10.9% |
Demographics Similar to Laotians by Unemployment Among Women with Children Ages 6 to 17 years
In terms of unemployment among women with children ages 6 to 17 years, the demographic groups most similar to Laotians are Immigrants from Cambodia (7.9%, a difference of 0.050%), Immigrants from Korea (7.9%, a difference of 0.11%), Immigrants from Iran (7.9%, a difference of 0.19%), Native Hawaiian (7.9%, a difference of 0.39%), and Immigrants from South Central Asia (7.9%, a difference of 0.50%).
| Demographics | Rating | Rank | Unemployment Among Women with Children Ages 6 to 17 years |
| Nepalese | 100.0 /100 | #24 | Exceptional 7.7% |
| Immigrants | Eastern Asia | 100.0 /100 | #25 | Exceptional 7.7% |
| Indians (Asian) | 100.0 /100 | #26 | Exceptional 7.7% |
| Immigrants | Afghanistan | 100.0 /100 | #27 | Exceptional 7.8% |
| Immigrants | Uzbekistan | 100.0 /100 | #28 | Exceptional 7.8% |
| Thais | 100.0 /100 | #29 | Exceptional 7.8% |
| Immigrants | Iran | 100.0 /100 | #30 | Exceptional 7.9% |
| Laotians | 100.0 /100 | #31 | Exceptional 7.9% |
| Immigrants | Cambodia | 100.0 /100 | #32 | Exceptional 7.9% |
| Immigrants | Korea | 100.0 /100 | #33 | Exceptional 7.9% |
| Native Hawaiians | 100.0 /100 | #34 | Exceptional 7.9% |
| Immigrants | South Central Asia | 100.0 /100 | #35 | Exceptional 7.9% |
| Burmese | 100.0 /100 | #36 | Exceptional 8.0% |
| Asians | 100.0 /100 | #37 | Exceptional 8.0% |
| Alsatians | 100.0 /100 | #38 | Exceptional 8.0% |