Moroccan vs Immigrants from Canada Unemployment Among Women with Children Under 6 years
COMPARE
Moroccan
Immigrants from Canada
Unemployment Among Women with Children Under 6 years
Unemployment Among Women with Children Under 6 years Comparison
Moroccans
Immigrants from Canada
7.9%
UNEMPLOYMENT AMONG WOMEN WITH CHILDREN UNDER 6 YEARS
9.7/ 100
METRIC RATING
218th/ 347
METRIC RANK
7.6%
UNEMPLOYMENT AMONG WOMEN WITH CHILDREN UNDER 6 YEARS
61.6/ 100
METRIC RATING
168th/ 347
METRIC RANK
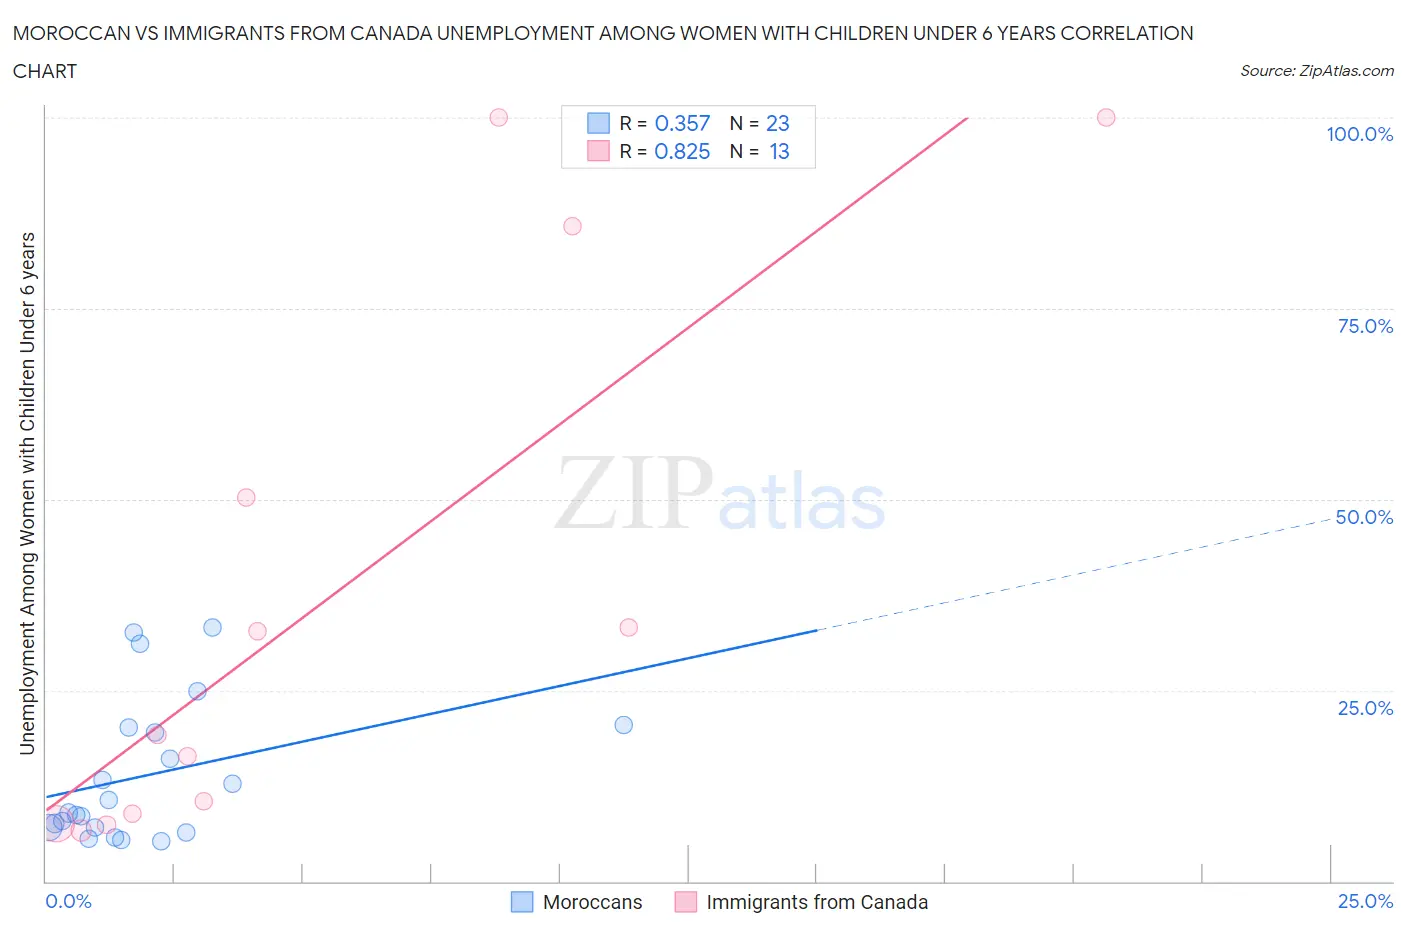
Moroccan vs Immigrants from Canada Unemployment Among Women with Children Under 6 years Correlation Chart
The statistical analysis conducted on geographies consisting of 172,421,104 people shows a mild positive correlation between the proportion of Moroccans and unemployment rate among women with children under the age of 6 in the United States with a correlation coefficient (R) of 0.357 and weighted average of 7.9%. Similarly, the statistical analysis conducted on geographies consisting of 330,910,201 people shows a very strong positive correlation between the proportion of Immigrants from Canada and unemployment rate among women with children under the age of 6 in the United States with a correlation coefficient (R) of 0.825 and weighted average of 7.6%, a difference of 4.5%.
Unemployment Among Women with Children Under 6 years Correlation Summary
| Measurement | Moroccan | Immigrants from Canada |
| Minimum | 5.3% | 6.6% |
| Maximum | 33.3% | 100.0% |
| Range | 28.0% | 93.4% |
| Mean | 13.9% | 36.8% |
| Median | 8.9% | 19.1% |
| Interquartile 25% (IQ1) | 7.0% | 8.2% |
| Interquartile 75% (IQ3) | 20.1% | 67.9% |
| Interquartile Range (IQR) | 13.1% | 59.7% |
| Standard Deviation (Sample) | 9.2% | 35.8% |
| Standard Deviation (Population) | 9.0% | 34.4% |
Similar Demographics by Unemployment Among Women with Children Under 6 years
Demographics Similar to Moroccans by Unemployment Among Women with Children Under 6 years
In terms of unemployment among women with children under 6 years, the demographic groups most similar to Moroccans are Arab (7.9%, a difference of 0.070%), South American Indian (7.9%, a difference of 0.090%), Immigrants from Nigeria (7.9%, a difference of 0.11%), Immigrants from Lebanon (7.9%, a difference of 0.23%), and Ecuadorian (7.9%, a difference of 0.24%).
| Demographics | Rating | Rank | Unemployment Among Women with Children Under 6 years |
| Immigrants | Ecuador | 14.9 /100 | #211 | Poor 7.9% |
| Swiss | 12.3 /100 | #212 | Poor 7.9% |
| Scottish | 11.4 /100 | #213 | Poor 7.9% |
| Spanish | 11.3 /100 | #214 | Poor 7.9% |
| Ecuadorians | 11.2 /100 | #215 | Poor 7.9% |
| Immigrants | Lebanon | 11.1 /100 | #216 | Poor 7.9% |
| Immigrants | Nigeria | 10.3 /100 | #217 | Poor 7.9% |
| Moroccans | 9.7 /100 | #218 | Tragic 7.9% |
| Arabs | 9.4 /100 | #219 | Tragic 7.9% |
| South American Indians | 9.3 /100 | #220 | Tragic 7.9% |
| Immigrants | Germany | 8.5 /100 | #221 | Tragic 7.9% |
| Samoans | 8.4 /100 | #222 | Tragic 7.9% |
| Carpatho Rusyns | 7.8 /100 | #223 | Tragic 8.0% |
| English | 7.2 /100 | #224 | Tragic 8.0% |
| Germans | 7.0 /100 | #225 | Tragic 8.0% |
Demographics Similar to Immigrants from Canada by Unemployment Among Women with Children Under 6 years
In terms of unemployment among women with children under 6 years, the demographic groups most similar to Immigrants from Canada are Immigrants from Scotland (7.6%, a difference of 0.020%), Kenyan (7.6%, a difference of 0.070%), Czech (7.6%, a difference of 0.12%), Belgian (7.6%, a difference of 0.14%), and Immigrants from Grenada (7.6%, a difference of 0.18%).
| Demographics | Rating | Rank | Unemployment Among Women with Children Under 6 years |
| Immigrants | Western Asia | 70.2 /100 | #161 | Good 7.5% |
| Immigrants | Lithuania | 68.8 /100 | #162 | Good 7.5% |
| British | 66.3 /100 | #163 | Good 7.6% |
| Ugandans | 65.8 /100 | #164 | Good 7.6% |
| Immigrants | South America | 65.6 /100 | #165 | Good 7.6% |
| Belgians | 63.5 /100 | #166 | Good 7.6% |
| Kenyans | 62.5 /100 | #167 | Good 7.6% |
| Immigrants | Canada | 61.6 /100 | #168 | Good 7.6% |
| Immigrants | Scotland | 61.3 /100 | #169 | Good 7.6% |
| Czechs | 59.8 /100 | #170 | Average 7.6% |
| Immigrants | Grenada | 59.0 /100 | #171 | Average 7.6% |
| Immigrants | North America | 57.7 /100 | #172 | Average 7.6% |
| Cree | 51.6 /100 | #173 | Average 7.6% |
| Immigrants | Laos | 50.0 /100 | #174 | Average 7.6% |
| Panamanians | 49.6 /100 | #175 | Average 7.6% |