Tohono O'odham vs Immigrants from Canada Unemployment Among Women with Children Under 6 years
COMPARE
Tohono O'odham
Immigrants from Canada
Unemployment Among Women with Children Under 6 years
Unemployment Among Women with Children Under 6 years Comparison
Tohono O'odham
Immigrants from Canada
10.2%
UNEMPLOYMENT AMONG WOMEN WITH CHILDREN UNDER 6 YEARS
0.0/ 100
METRIC RATING
328th/ 347
METRIC RANK
7.6%
UNEMPLOYMENT AMONG WOMEN WITH CHILDREN UNDER 6 YEARS
61.6/ 100
METRIC RATING
168th/ 347
METRIC RANK
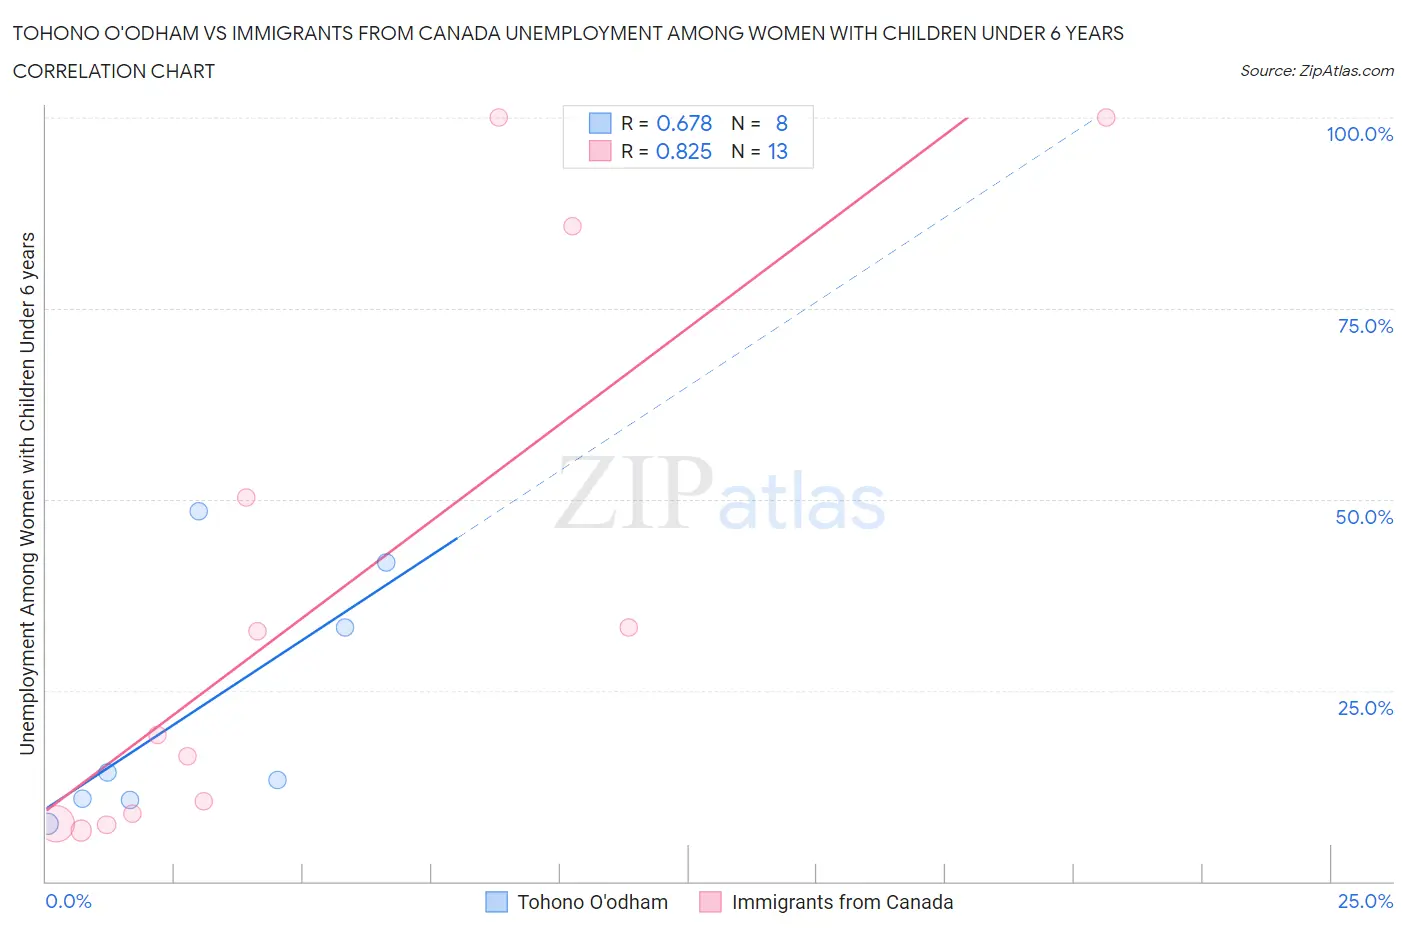
Tohono O'odham vs Immigrants from Canada Unemployment Among Women with Children Under 6 years Correlation Chart
The statistical analysis conducted on geographies consisting of 55,207,306 people shows a significant positive correlation between the proportion of Tohono O'odham and unemployment rate among women with children under the age of 6 in the United States with a correlation coefficient (R) of 0.678 and weighted average of 10.2%. Similarly, the statistical analysis conducted on geographies consisting of 330,910,201 people shows a very strong positive correlation between the proportion of Immigrants from Canada and unemployment rate among women with children under the age of 6 in the United States with a correlation coefficient (R) of 0.825 and weighted average of 7.6%, a difference of 34.4%.
Unemployment Among Women with Children Under 6 years Correlation Summary
| Measurement | Tohono O'odham | Immigrants from Canada |
| Minimum | 7.5% | 6.6% |
| Maximum | 48.4% | 100.0% |
| Range | 40.9% | 93.4% |
| Mean | 22.5% | 36.8% |
| Median | 13.8% | 19.1% |
| Interquartile 25% (IQ1) | 10.8% | 8.2% |
| Interquartile 75% (IQ3) | 37.5% | 67.9% |
| Interquartile Range (IQR) | 26.7% | 59.7% |
| Standard Deviation (Sample) | 16.1% | 35.8% |
| Standard Deviation (Population) | 15.0% | 34.4% |
Similar Demographics by Unemployment Among Women with Children Under 6 years
Demographics Similar to Tohono O'odham by Unemployment Among Women with Children Under 6 years
In terms of unemployment among women with children under 6 years, the demographic groups most similar to Tohono O'odham are Black/African American (10.3%, a difference of 0.74%), Ottawa (9.9%, a difference of 3.3%), Delaware (9.8%, a difference of 4.2%), Choctaw (9.8%, a difference of 4.2%), and Paiute (9.7%, a difference of 5.2%).
| Demographics | Rating | Rank | Unemployment Among Women with Children Under 6 years |
| Central American Indians | 0.0 /100 | #321 | Tragic 9.6% |
| Alaska Natives | 0.0 /100 | #322 | Tragic 9.6% |
| Immigrants | Bahamas | 0.0 /100 | #323 | Tragic 9.6% |
| Paiute | 0.0 /100 | #324 | Tragic 9.7% |
| Choctaw | 0.0 /100 | #325 | Tragic 9.8% |
| Delaware | 0.0 /100 | #326 | Tragic 9.8% |
| Ottawa | 0.0 /100 | #327 | Tragic 9.9% |
| Tohono O'odham | 0.0 /100 | #328 | Tragic 10.2% |
| Blacks/African Americans | 0.0 /100 | #329 | Tragic 10.3% |
| Pennsylvania Germans | 0.0 /100 | #330 | Tragic 10.8% |
| Colville | 0.0 /100 | #331 | Tragic 11.2% |
| Sioux | 0.0 /100 | #332 | Tragic 11.5% |
| Natives/Alaskans | 0.0 /100 | #333 | Tragic 11.5% |
| Apache | 0.0 /100 | #334 | Tragic 12.3% |
| Puerto Ricans | 0.0 /100 | #335 | Tragic 12.5% |
Demographics Similar to Immigrants from Canada by Unemployment Among Women with Children Under 6 years
In terms of unemployment among women with children under 6 years, the demographic groups most similar to Immigrants from Canada are Immigrants from Scotland (7.6%, a difference of 0.020%), Kenyan (7.6%, a difference of 0.070%), Czech (7.6%, a difference of 0.12%), Belgian (7.6%, a difference of 0.14%), and Immigrants from Grenada (7.6%, a difference of 0.18%).
| Demographics | Rating | Rank | Unemployment Among Women with Children Under 6 years |
| Immigrants | Western Asia | 70.2 /100 | #161 | Good 7.5% |
| Immigrants | Lithuania | 68.8 /100 | #162 | Good 7.5% |
| British | 66.3 /100 | #163 | Good 7.6% |
| Ugandans | 65.8 /100 | #164 | Good 7.6% |
| Immigrants | South America | 65.6 /100 | #165 | Good 7.6% |
| Belgians | 63.5 /100 | #166 | Good 7.6% |
| Kenyans | 62.5 /100 | #167 | Good 7.6% |
| Immigrants | Canada | 61.6 /100 | #168 | Good 7.6% |
| Immigrants | Scotland | 61.3 /100 | #169 | Good 7.6% |
| Czechs | 59.8 /100 | #170 | Average 7.6% |
| Immigrants | Grenada | 59.0 /100 | #171 | Average 7.6% |
| Immigrants | North America | 57.7 /100 | #172 | Average 7.6% |
| Cree | 51.6 /100 | #173 | Average 7.6% |
| Immigrants | Laos | 50.0 /100 | #174 | Average 7.6% |
| Panamanians | 49.6 /100 | #175 | Average 7.6% |