Aleut vs Tsimshian Seniors Poverty Over the Age of 65
COMPARE
Aleut
Tsimshian
Seniors Poverty Over the Age of 65
Seniors Poverty Over the Age of 65 Comparison
Aleuts
Tsimshian
10.3%
SENIORS POVERTY OVER THE AGE OF 65
94.1/ 100
METRIC RATING
105th/ 347
METRIC RANK
10.8%
SENIORS POVERTY OVER THE AGE OF 65
64.5/ 100
METRIC RATING
163rd/ 347
METRIC RANK
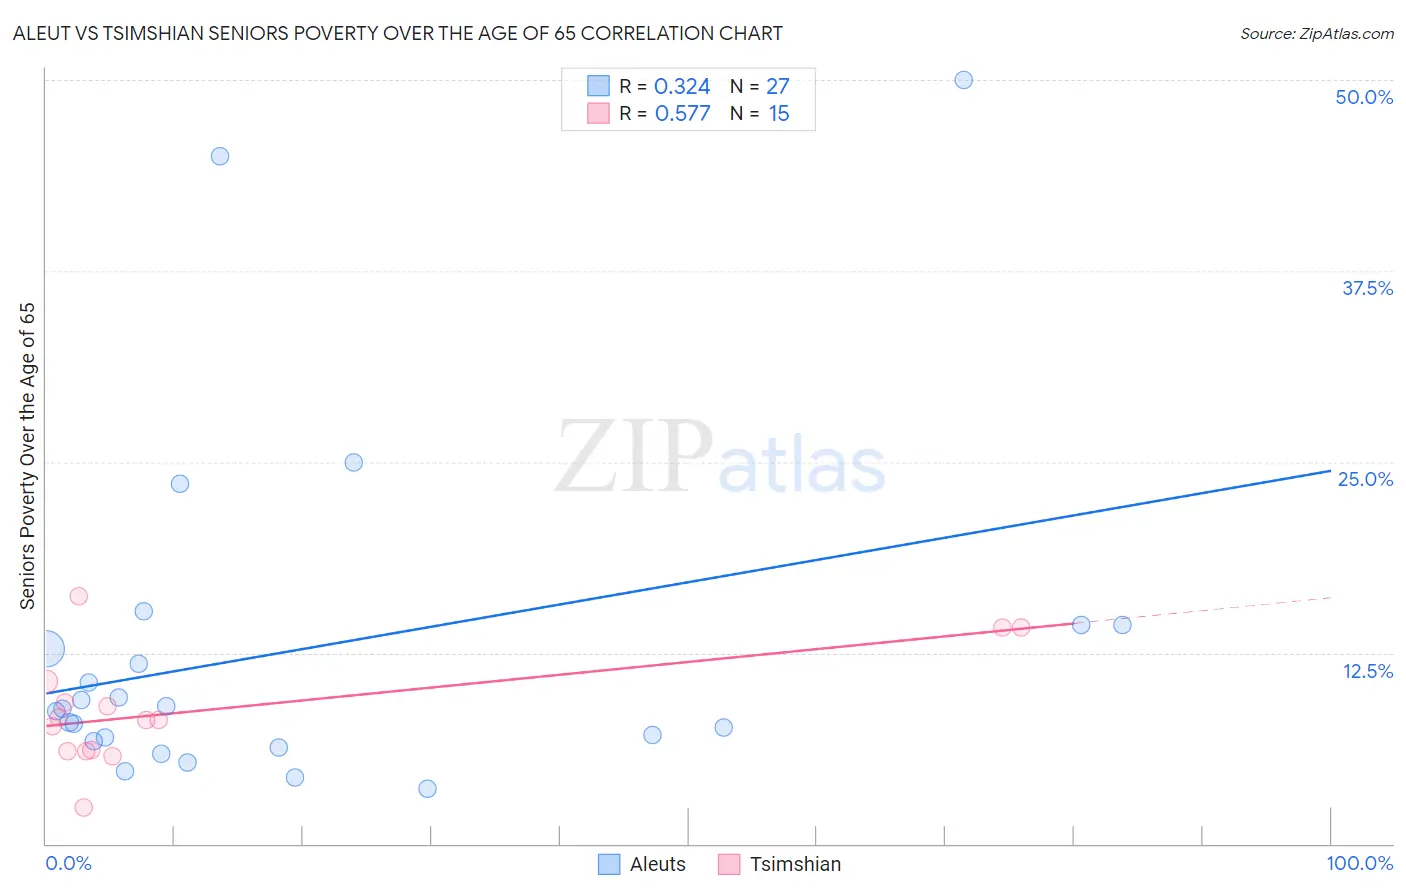
Aleut vs Tsimshian Seniors Poverty Over the Age of 65 Correlation Chart
The statistical analysis conducted on geographies consisting of 61,670,164 people shows a mild positive correlation between the proportion of Aleuts and poverty level among seniors over the age of 65 in the United States with a correlation coefficient (R) of 0.324 and weighted average of 10.3%. Similarly, the statistical analysis conducted on geographies consisting of 15,615,288 people shows a substantial positive correlation between the proportion of Tsimshian and poverty level among seniors over the age of 65 in the United States with a correlation coefficient (R) of 0.577 and weighted average of 10.8%, a difference of 5.1%.
Seniors Poverty Over the Age of 65 Correlation Summary
| Measurement | Aleut | Tsimshian |
| Minimum | 3.6% | 2.3% |
| Maximum | 50.0% | 16.2% |
| Range | 46.4% | 13.8% |
| Mean | 12.7% | 8.8% |
| Median | 8.9% | 8.1% |
| Interquartile 25% (IQ1) | 6.7% | 6.1% |
| Interquartile 75% (IQ3) | 14.3% | 10.6% |
| Interquartile Range (IQR) | 7.6% | 4.5% |
| Standard Deviation (Sample) | 11.3% | 3.7% |
| Standard Deviation (Population) | 11.1% | 3.6% |
Similar Demographics by Seniors Poverty Over the Age of 65
Demographics Similar to Aleuts by Seniors Poverty Over the Age of 65
In terms of seniors poverty over the age of 65, the demographic groups most similar to Aleuts are Kenyan (10.3%, a difference of 0.020%), South African (10.3%, a difference of 0.070%), Hawaiian (10.3%, a difference of 0.090%), Immigrants from Croatia (10.3%, a difference of 0.090%), and Icelander (10.3%, a difference of 0.11%).
| Demographics | Rating | Rank | Seniors Poverty Over the Age of 65 |
| Immigrants | Kuwait | 95.5 /100 | #98 | Exceptional 10.2% |
| Cypriots | 95.5 /100 | #99 | Exceptional 10.2% |
| Marshallese | 95.3 /100 | #100 | Exceptional 10.2% |
| Immigrants | Jordan | 94.7 /100 | #101 | Exceptional 10.2% |
| Delaware | 94.5 /100 | #102 | Exceptional 10.2% |
| Icelanders | 94.4 /100 | #103 | Exceptional 10.3% |
| South Africans | 94.3 /100 | #104 | Exceptional 10.3% |
| Aleuts | 94.1 /100 | #105 | Exceptional 10.3% |
| Kenyans | 94.1 /100 | #106 | Exceptional 10.3% |
| Hawaiians | 93.9 /100 | #107 | Exceptional 10.3% |
| Immigrants | Croatia | 93.9 /100 | #108 | Exceptional 10.3% |
| Syrians | 93.8 /100 | #109 | Exceptional 10.3% |
| Immigrants | Zimbabwe | 93.5 /100 | #110 | Exceptional 10.3% |
| Immigrants | Belgium | 93.4 /100 | #111 | Exceptional 10.3% |
| Immigrants | Korea | 93.3 /100 | #112 | Exceptional 10.3% |
Demographics Similar to Tsimshian by Seniors Poverty Over the Age of 65
In terms of seniors poverty over the age of 65, the demographic groups most similar to Tsimshian are Immigrants from Indonesia (10.8%, a difference of 0.030%), Arab (10.8%, a difference of 0.070%), Potawatomi (10.8%, a difference of 0.19%), Immigrants from South Eastern Asia (10.8%, a difference of 0.23%), and Malaysian (10.8%, a difference of 0.24%).
| Demographics | Rating | Rank | Seniors Poverty Over the Age of 65 |
| Ethiopians | 72.9 /100 | #156 | Good 10.7% |
| Immigrants | Ethiopia | 72.9 /100 | #157 | Good 10.7% |
| Immigrants | Sierra Leone | 71.7 /100 | #158 | Good 10.7% |
| Immigrants | Micronesia | 70.8 /100 | #159 | Good 10.7% |
| Sudanese | 68.2 /100 | #160 | Good 10.7% |
| Arabs | 65.2 /100 | #161 | Good 10.8% |
| Immigrants | Indonesia | 64.8 /100 | #162 | Good 10.8% |
| Tsimshian | 64.5 /100 | #163 | Good 10.8% |
| Potawatomi | 62.6 /100 | #164 | Good 10.8% |
| Immigrants | South Eastern Asia | 62.1 /100 | #165 | Good 10.8% |
| Malaysians | 62.0 /100 | #166 | Good 10.8% |
| Alaska Natives | 60.3 /100 | #167 | Good 10.8% |
| Mongolians | 58.0 /100 | #168 | Average 10.9% |
| Sri Lankans | 56.8 /100 | #169 | Average 10.9% |
| Immigrants | Eastern Europe | 55.8 /100 | #170 | Average 10.9% |