Aleut vs Immigrants from Nigeria Unemployment Among Women with Children Under 6 years
COMPARE
Aleut
Immigrants from Nigeria
Unemployment Among Women with Children Under 6 years
Unemployment Among Women with Children Under 6 years Comparison
Aleuts
Immigrants from Nigeria
7.5%
UNEMPLOYMENT AMONG WOMEN WITH CHILDREN UNDER 6 YEARS
76.0/ 100
METRIC RATING
150th/ 347
METRIC RANK
7.9%
UNEMPLOYMENT AMONG WOMEN WITH CHILDREN UNDER 6 YEARS
10.3/ 100
METRIC RATING
217th/ 347
METRIC RANK
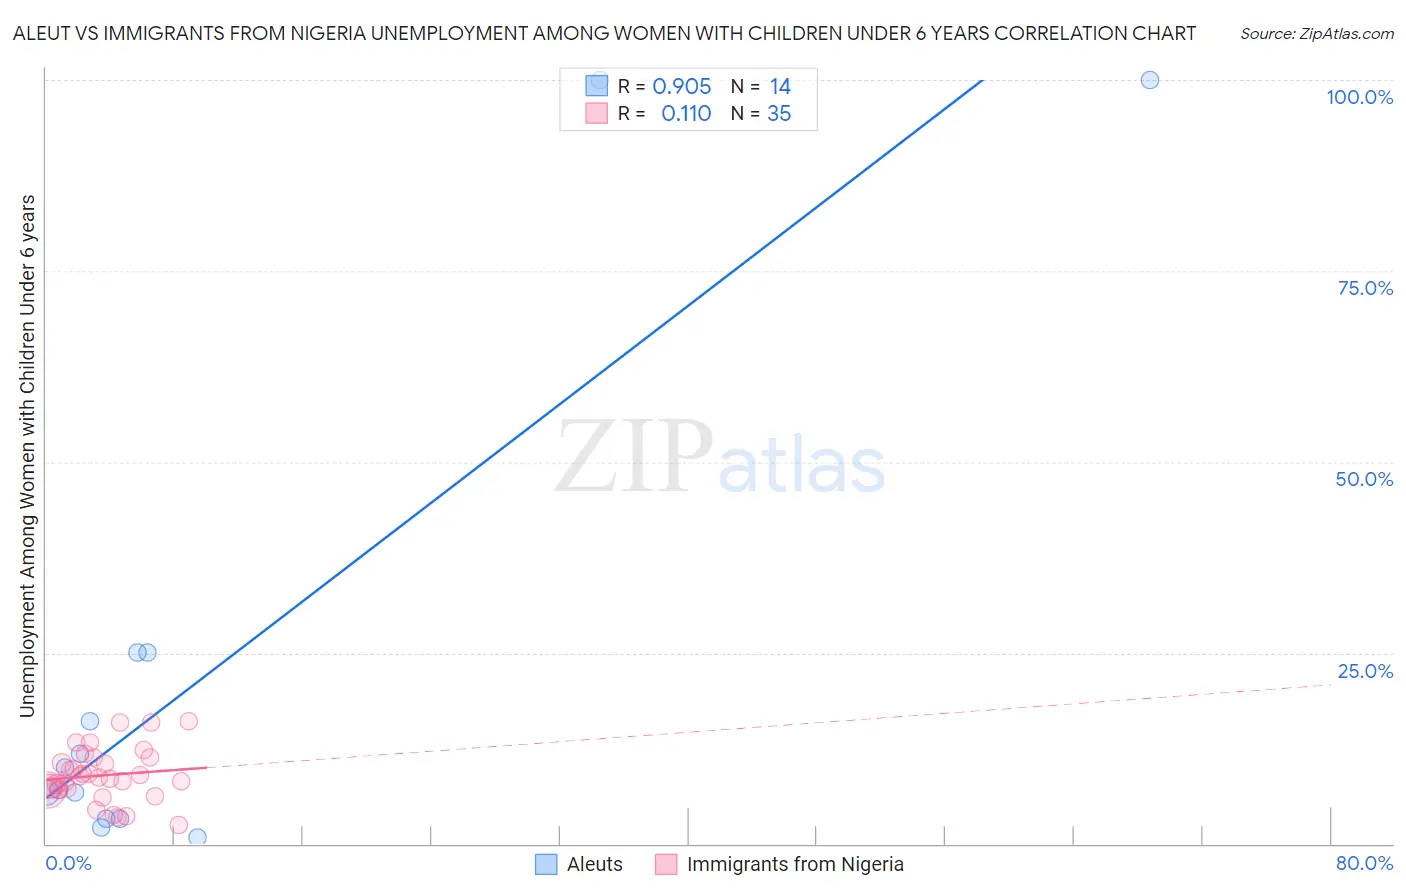
Aleut vs Immigrants from Nigeria Unemployment Among Women with Children Under 6 years Correlation Chart
The statistical analysis conducted on geographies consisting of 56,364,668 people shows a near-perfect positive correlation between the proportion of Aleuts and unemployment rate among women with children under the age of 6 in the United States with a correlation coefficient (R) of 0.905 and weighted average of 7.5%. Similarly, the statistical analysis conducted on geographies consisting of 235,747,701 people shows a poor positive correlation between the proportion of Immigrants from Nigeria and unemployment rate among women with children under the age of 6 in the United States with a correlation coefficient (R) of 0.110 and weighted average of 7.9%, a difference of 5.6%.
Unemployment Among Women with Children Under 6 years Correlation Summary
| Measurement | Aleut | Immigrants from Nigeria |
| Minimum | 0.80% | 2.5% |
| Maximum | 100.0% | 16.0% |
| Range | 99.2% | 13.5% |
| Mean | 22.7% | 9.0% |
| Median | 8.5% | 8.6% |
| Interquartile 25% (IQ1) | 3.3% | 7.2% |
| Interquartile 75% (IQ3) | 25.0% | 11.3% |
| Interquartile Range (IQR) | 21.7% | 4.1% |
| Standard Deviation (Sample) | 33.6% | 3.4% |
| Standard Deviation (Population) | 32.4% | 3.4% |
Similar Demographics by Unemployment Among Women with Children Under 6 years
Demographics Similar to Aleuts by Unemployment Among Women with Children Under 6 years
In terms of unemployment among women with children under 6 years, the demographic groups most similar to Aleuts are Colombian (7.5%, a difference of 0.010%), Immigrants from Peru (7.5%, a difference of 0.10%), Bangladeshi (7.5%, a difference of 0.11%), Immigrants from Brazil (7.5%, a difference of 0.12%), and Uruguayan (7.5%, a difference of 0.12%).
| Demographics | Rating | Rank | Unemployment Among Women with Children Under 6 years |
| Koreans | 81.3 /100 | #143 | Excellent 7.5% |
| Europeans | 79.1 /100 | #144 | Good 7.5% |
| Immigrants | Jordan | 78.9 /100 | #145 | Good 7.5% |
| Japanese | 78.9 /100 | #146 | Good 7.5% |
| Immigrants | Oceania | 78.4 /100 | #147 | Good 7.5% |
| Immigrants | Brazil | 77.3 /100 | #148 | Good 7.5% |
| Colombians | 76.1 /100 | #149 | Good 7.5% |
| Aleuts | 76.0 /100 | #150 | Good 7.5% |
| Immigrants | Peru | 74.9 /100 | #151 | Good 7.5% |
| Bangladeshis | 74.8 /100 | #152 | Good 7.5% |
| Uruguayans | 74.7 /100 | #153 | Good 7.5% |
| Northern Europeans | 74.3 /100 | #154 | Good 7.5% |
| South Americans | 74.1 /100 | #155 | Good 7.5% |
| Immigrants | Southern Europe | 73.2 /100 | #156 | Good 7.5% |
| Peruvians | 72.3 /100 | #157 | Good 7.5% |
Demographics Similar to Immigrants from Nigeria by Unemployment Among Women with Children Under 6 years
In terms of unemployment among women with children under 6 years, the demographic groups most similar to Immigrants from Nigeria are Moroccan (7.9%, a difference of 0.11%), Immigrants from Lebanon (7.9%, a difference of 0.12%), Ecuadorian (7.9%, a difference of 0.14%), Spanish (7.9%, a difference of 0.15%), and Scottish (7.9%, a difference of 0.17%).
| Demographics | Rating | Rank | Unemployment Among Women with Children Under 6 years |
| Poles | 16.0 /100 | #210 | Poor 7.9% |
| Immigrants | Ecuador | 14.9 /100 | #211 | Poor 7.9% |
| Swiss | 12.3 /100 | #212 | Poor 7.9% |
| Scottish | 11.4 /100 | #213 | Poor 7.9% |
| Spanish | 11.3 /100 | #214 | Poor 7.9% |
| Ecuadorians | 11.2 /100 | #215 | Poor 7.9% |
| Immigrants | Lebanon | 11.1 /100 | #216 | Poor 7.9% |
| Immigrants | Nigeria | 10.3 /100 | #217 | Poor 7.9% |
| Moroccans | 9.7 /100 | #218 | Tragic 7.9% |
| Arabs | 9.4 /100 | #219 | Tragic 7.9% |
| South American Indians | 9.3 /100 | #220 | Tragic 7.9% |
| Immigrants | Germany | 8.5 /100 | #221 | Tragic 7.9% |
| Samoans | 8.4 /100 | #222 | Tragic 7.9% |
| Carpatho Rusyns | 7.8 /100 | #223 | Tragic 8.0% |
| English | 7.2 /100 | #224 | Tragic 8.0% |