Immigrants from Western Asia vs Serbian Unemployment Among Seniors over 75 years
COMPARE
Immigrants from Western Asia
Serbian
Unemployment Among Seniors over 75 years
Unemployment Among Seniors over 75 years Comparison
Immigrants from Western Asia
Serbians
9.0%
UNEMPLOYMENT AMONG SENIORS OVER 75 YEARS
12.5/ 100
METRIC RATING
215th/ 347
METRIC RANK
8.4%
UNEMPLOYMENT AMONG SENIORS OVER 75 YEARS
93.7/ 100
METRIC RATING
133rd/ 347
METRIC RANK
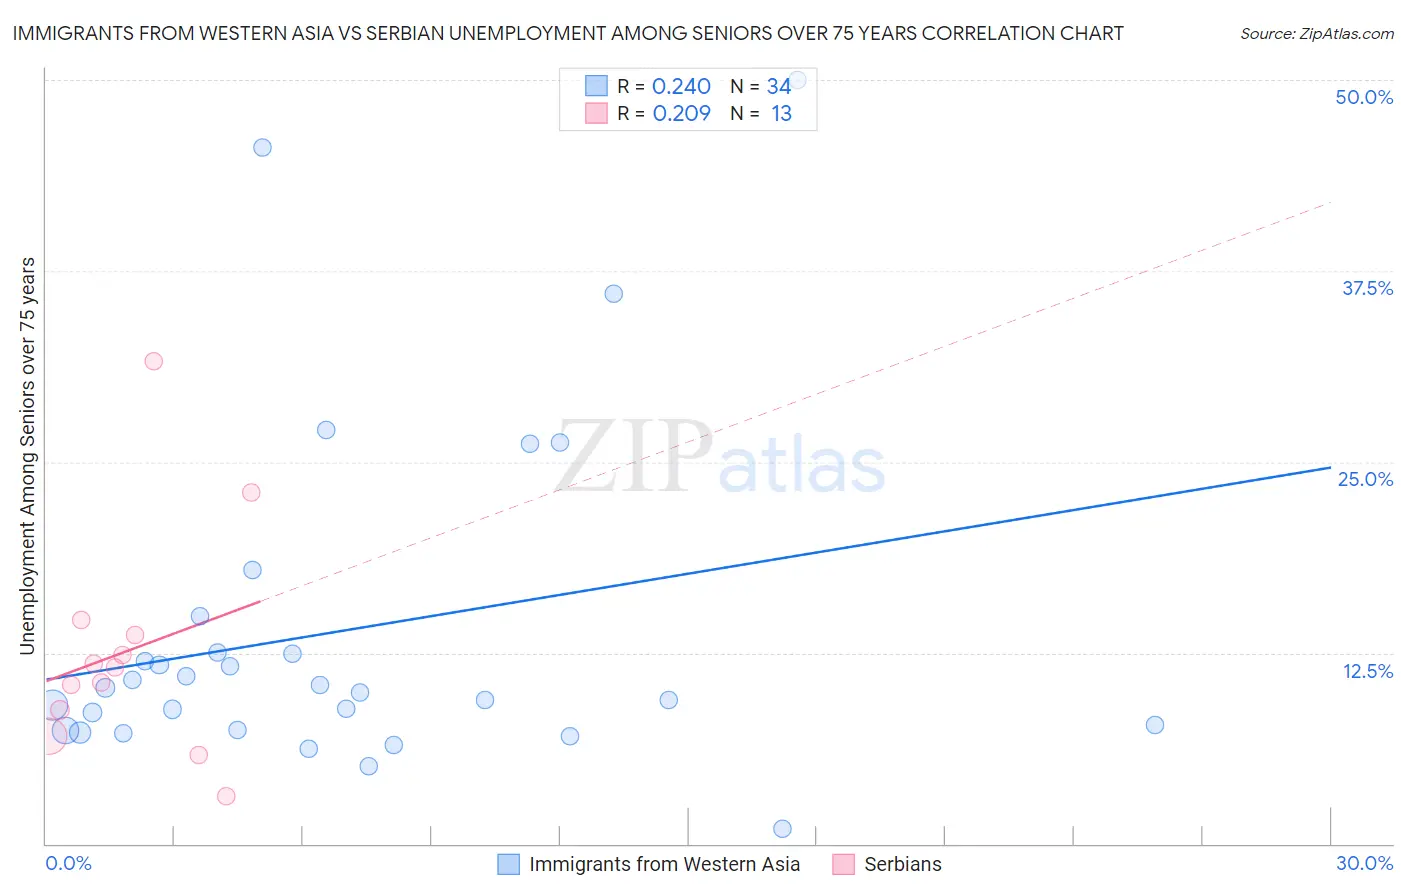
Immigrants from Western Asia vs Serbian Unemployment Among Seniors over 75 years Correlation Chart
The statistical analysis conducted on geographies consisting of 206,828,449 people shows a weak positive correlation between the proportion of Immigrants from Western Asia and unemployment rate among seniors over the age of 75 in the United States with a correlation coefficient (R) of 0.240 and weighted average of 9.0%. Similarly, the statistical analysis conducted on geographies consisting of 156,247,498 people shows a weak positive correlation between the proportion of Serbians and unemployment rate among seniors over the age of 75 in the United States with a correlation coefficient (R) of 0.209 and weighted average of 8.4%, a difference of 6.5%.
Unemployment Among Seniors over 75 years Correlation Summary
| Measurement | Immigrants from Western Asia | Serbian |
| Minimum | 1.0% | 3.1% |
| Maximum | 50.0% | 31.6% |
| Range | 49.0% | 28.5% |
| Mean | 13.9% | 12.6% |
| Median | 10.0% | 11.5% |
| Interquartile 25% (IQ1) | 7.4% | 7.9% |
| Interquartile 75% (IQ3) | 12.5% | 14.1% |
| Interquartile Range (IQR) | 5.0% | 6.3% |
| Standard Deviation (Sample) | 11.2% | 7.5% |
| Standard Deviation (Population) | 11.0% | 7.2% |
Similar Demographics by Unemployment Among Seniors over 75 years
Demographics Similar to Immigrants from Western Asia by Unemployment Among Seniors over 75 years
In terms of unemployment among seniors over 75 years, the demographic groups most similar to Immigrants from Western Asia are Immigrants from Oceania (9.0%, a difference of 0.080%), Immigrants from Brazil (9.0%, a difference of 0.090%), Immigrants from Latin America (9.0%, a difference of 0.11%), Romanian (9.0%, a difference of 0.15%), and Lebanese (9.0%, a difference of 0.18%).
| Demographics | Rating | Rank | Unemployment Among Seniors over 75 years |
| Immigrants | Philippines | 15.8 /100 | #208 | Poor 8.9% |
| Salvadorans | 15.4 /100 | #209 | Poor 8.9% |
| Bermudans | 15.0 /100 | #210 | Poor 8.9% |
| Delaware | 14.6 /100 | #211 | Poor 9.0% |
| Romanians | 13.8 /100 | #212 | Poor 9.0% |
| Immigrants | Latin America | 13.4 /100 | #213 | Poor 9.0% |
| Immigrants | Brazil | 13.3 /100 | #214 | Poor 9.0% |
| Immigrants | Western Asia | 12.5 /100 | #215 | Poor 9.0% |
| Immigrants | Oceania | 11.8 /100 | #216 | Poor 9.0% |
| Lebanese | 11.1 /100 | #217 | Poor 9.0% |
| Immigrants | Africa | 9.7 /100 | #218 | Tragic 9.0% |
| Afghans | 8.3 /100 | #219 | Tragic 9.0% |
| Immigrants | Zimbabwe | 7.8 /100 | #220 | Tragic 9.0% |
| Guamanians/Chamorros | 7.7 /100 | #221 | Tragic 9.0% |
| Peruvians | 7.3 /100 | #222 | Tragic 9.0% |
Demographics Similar to Serbians by Unemployment Among Seniors over 75 years
In terms of unemployment among seniors over 75 years, the demographic groups most similar to Serbians are Chilean (8.4%, a difference of 0.030%), Immigrants from Czechoslovakia (8.4%, a difference of 0.080%), German Russian (8.4%, a difference of 0.31%), Apache (8.4%, a difference of 0.39%), and Haitian (8.5%, a difference of 0.47%).
| Demographics | Rating | Rank | Unemployment Among Seniors over 75 years |
| Belizeans | 96.3 /100 | #126 | Exceptional 8.4% |
| Hondurans | 96.2 /100 | #127 | Exceptional 8.4% |
| Native Hawaiians | 96.1 /100 | #128 | Exceptional 8.4% |
| Ghanaians | 96.0 /100 | #129 | Exceptional 8.4% |
| Apache | 95.2 /100 | #130 | Exceptional 8.4% |
| German Russians | 94.9 /100 | #131 | Exceptional 8.4% |
| Chileans | 93.8 /100 | #132 | Exceptional 8.4% |
| Serbians | 93.7 /100 | #133 | Exceptional 8.4% |
| Immigrants | Czechoslovakia | 93.4 /100 | #134 | Exceptional 8.4% |
| Haitians | 91.4 /100 | #135 | Exceptional 8.5% |
| Immigrants | Trinidad and Tobago | 90.8 /100 | #136 | Exceptional 8.5% |
| Immigrants | Kuwait | 90.5 /100 | #137 | Exceptional 8.5% |
| Immigrants | Bulgaria | 89.6 /100 | #138 | Excellent 8.5% |
| Barbadians | 88.6 /100 | #139 | Excellent 8.5% |
| South Americans | 87.9 /100 | #140 | Excellent 8.5% |