Immigrants from Australia vs Immigrants from Bolivia Unemployment Among Youth under 25 years
COMPARE
Immigrants from Australia
Immigrants from Bolivia
Unemployment Among Youth under 25 years
Unemployment Among Youth under 25 years Comparison
Immigrants from Australia
Immigrants from Bolivia
11.2%
UNEMPLOYMENT AMONG YOUTH UNDER 25 YEARS
97.3/ 100
METRIC RATING
72nd/ 347
METRIC RANK
11.2%
UNEMPLOYMENT AMONG YOUTH UNDER 25 YEARS
95.5/ 100
METRIC RATING
90th/ 347
METRIC RANK
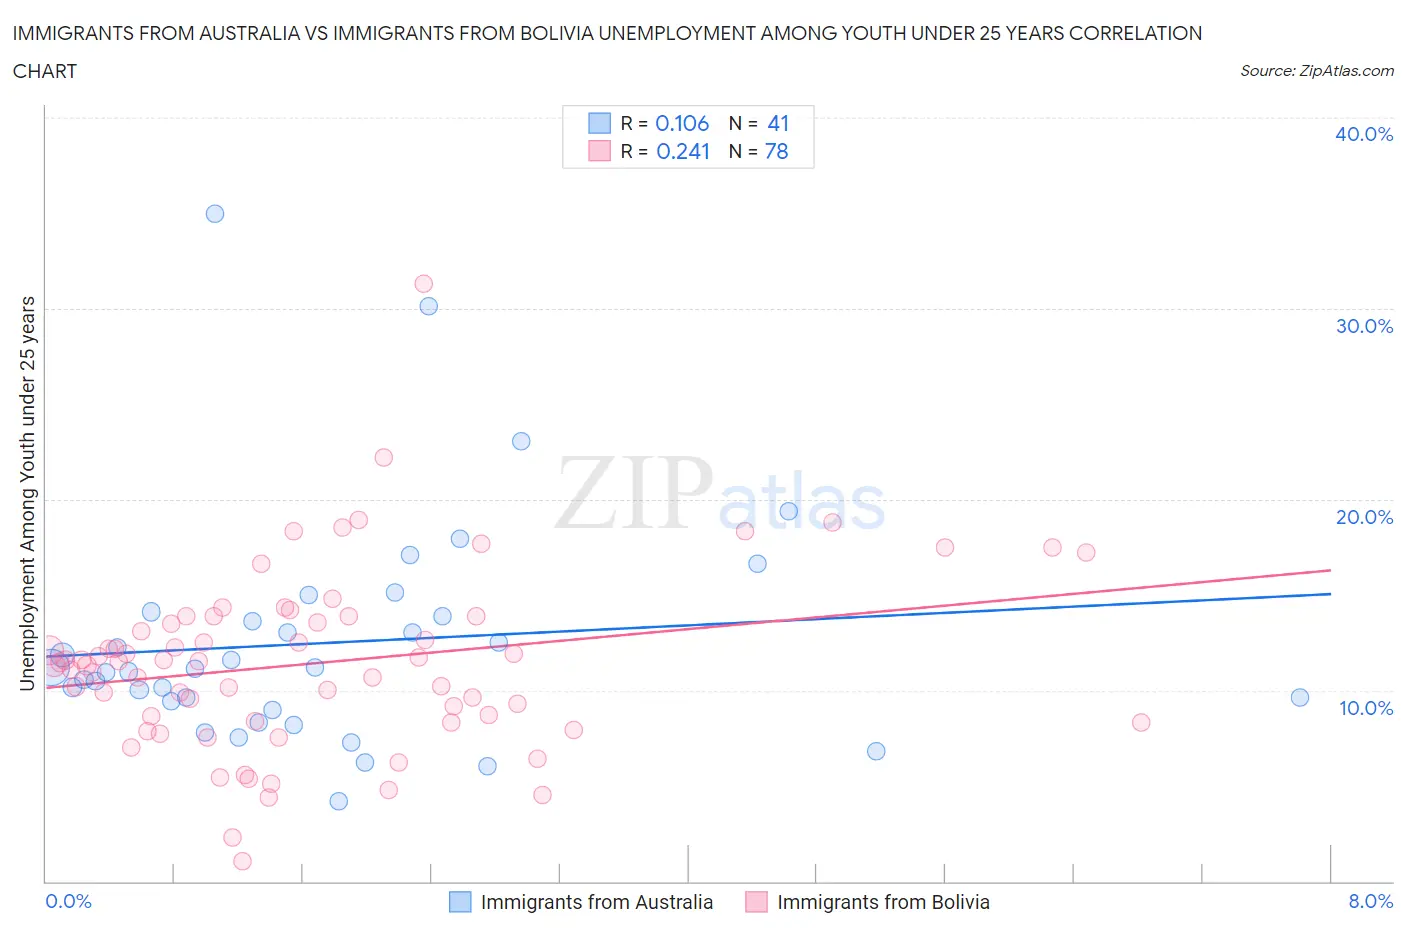
Immigrants from Australia vs Immigrants from Bolivia Unemployment Among Youth under 25 years Correlation Chart
The statistical analysis conducted on geographies consisting of 225,367,342 people shows a poor positive correlation between the proportion of Immigrants from Australia and unemployment rate among youth under the age of 25 in the United States with a correlation coefficient (R) of 0.106 and weighted average of 11.2%. Similarly, the statistical analysis conducted on geographies consisting of 158,119,708 people shows a weak positive correlation between the proportion of Immigrants from Bolivia and unemployment rate among youth under the age of 25 in the United States with a correlation coefficient (R) of 0.241 and weighted average of 11.2%, a difference of 0.58%.
Unemployment Among Youth under 25 years Correlation Summary
| Measurement | Immigrants from Australia | Immigrants from Bolivia |
| Minimum | 4.2% | 1.0% |
| Maximum | 34.9% | 31.3% |
| Range | 30.8% | 30.3% |
| Mean | 12.5% | 11.4% |
| Median | 11.2% | 11.5% |
| Interquartile 25% (IQ1) | 9.2% | 8.4% |
| Interquartile 75% (IQ3) | 14.0% | 13.8% |
| Interquartile Range (IQR) | 4.8% | 5.5% |
| Standard Deviation (Sample) | 6.0% | 4.7% |
| Standard Deviation (Population) | 5.9% | 4.7% |
Demographics Similar to Immigrants from Australia and Immigrants from Bolivia by Unemployment Among Youth under 25 years
In terms of unemployment among youth under 25 years, the demographic groups most similar to Immigrants from Australia are Bhutanese (11.2%, a difference of 0.040%), Creek (11.2%, a difference of 0.050%), New Zealander (11.2%, a difference of 0.060%), French (11.2%, a difference of 0.090%), and German Russian (11.2%, a difference of 0.11%). Similarly, the demographic groups most similar to Immigrants from Bolivia are Austrian (11.2%, a difference of 0.010%), Immigrants from Japan (11.2%, a difference of 0.010%), Kenyan (11.2%, a difference of 0.070%), Immigrants from South Africa (11.2%, a difference of 0.080%), and Immigrants from Taiwan (11.2%, a difference of 0.080%).
| Demographics | Rating | Rank | Unemployment Among Youth under 25 years |
| Bhutanese | 97.4 /100 | #71 | Exceptional 11.2% |
| Immigrants | Australia | 97.3 /100 | #72 | Exceptional 11.2% |
| Creek | 97.2 /100 | #73 | Exceptional 11.2% |
| New Zealanders | 97.2 /100 | #74 | Exceptional 11.2% |
| French | 97.1 /100 | #75 | Exceptional 11.2% |
| German Russians | 97.0 /100 | #76 | Exceptional 11.2% |
| Whites/Caucasians | 96.9 /100 | #77 | Exceptional 11.2% |
| Immigrants | Nicaragua | 96.7 /100 | #78 | Exceptional 11.2% |
| Immigrants | Canada | 96.7 /100 | #79 | Exceptional 11.2% |
| Immigrants | Bulgaria | 96.4 /100 | #80 | Exceptional 11.2% |
| Icelanders | 96.3 /100 | #81 | Exceptional 11.2% |
| Northern Europeans | 96.2 /100 | #82 | Exceptional 11.2% |
| Bolivians | 96.1 /100 | #83 | Exceptional 11.2% |
| French Canadians | 95.9 /100 | #84 | Exceptional 11.2% |
| Immigrants | South Central Asia | 95.9 /100 | #85 | Exceptional 11.2% |
| Immigrants | South Africa | 95.8 /100 | #86 | Exceptional 11.2% |
| Kenyans | 95.7 /100 | #87 | Exceptional 11.2% |
| Austrians | 95.5 /100 | #88 | Exceptional 11.2% |
| Immigrants | Japan | 95.5 /100 | #89 | Exceptional 11.2% |
| Immigrants | Bolivia | 95.5 /100 | #90 | Exceptional 11.2% |
| Immigrants | Taiwan | 95.1 /100 | #91 | Exceptional 11.2% |