Immigrants from Burma/Myanmar vs Immigrants from Bolivia Unemployment Among Youth under 25 years
COMPARE
Immigrants from Burma/Myanmar
Immigrants from Bolivia
Unemployment Among Youth under 25 years
Unemployment Among Youth under 25 years Comparison
Immigrants from Burma/Myanmar
Immigrants from Bolivia
10.6%
UNEMPLOYMENT AMONG YOUTH UNDER 25 YEARS
100.0/ 100
METRIC RATING
19th/ 347
METRIC RANK
11.2%
UNEMPLOYMENT AMONG YOUTH UNDER 25 YEARS
95.5/ 100
METRIC RATING
90th/ 347
METRIC RANK
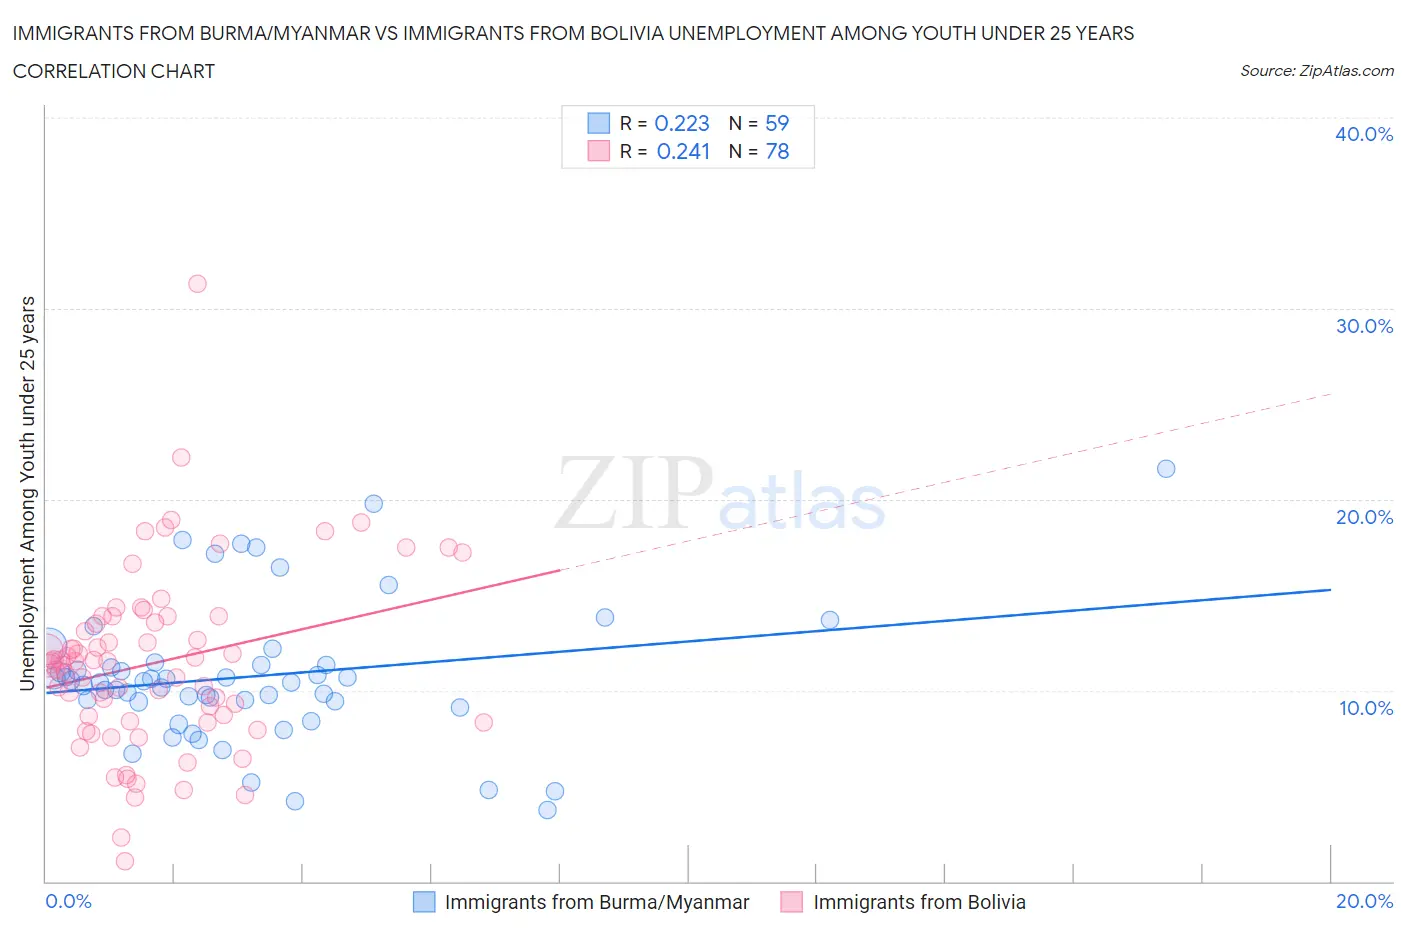
Immigrants from Burma/Myanmar vs Immigrants from Bolivia Unemployment Among Youth under 25 years Correlation Chart
The statistical analysis conducted on geographies consisting of 171,764,683 people shows a weak positive correlation between the proportion of Immigrants from Burma/Myanmar and unemployment rate among youth under the age of 25 in the United States with a correlation coefficient (R) of 0.223 and weighted average of 10.6%. Similarly, the statistical analysis conducted on geographies consisting of 158,119,708 people shows a weak positive correlation between the proportion of Immigrants from Bolivia and unemployment rate among youth under the age of 25 in the United States with a correlation coefficient (R) of 0.241 and weighted average of 11.2%, a difference of 6.1%.
Unemployment Among Youth under 25 years Correlation Summary
| Measurement | Immigrants from Burma/Myanmar | Immigrants from Bolivia |
| Minimum | 3.7% | 1.0% |
| Maximum | 21.6% | 31.3% |
| Range | 17.9% | 30.3% |
| Mean | 10.7% | 11.4% |
| Median | 10.4% | 11.5% |
| Interquartile 25% (IQ1) | 9.4% | 8.4% |
| Interquartile 75% (IQ3) | 11.3% | 13.8% |
| Interquartile Range (IQR) | 1.9% | 5.5% |
| Standard Deviation (Sample) | 3.6% | 4.7% |
| Standard Deviation (Population) | 3.6% | 4.7% |
Similar Demographics by Unemployment Among Youth under 25 years
Demographics Similar to Immigrants from Burma/Myanmar by Unemployment Among Youth under 25 years
In terms of unemployment among youth under 25 years, the demographic groups most similar to Immigrants from Burma/Myanmar are Swiss (10.6%, a difference of 0.010%), Dutch (10.6%, a difference of 0.020%), Menominee (10.6%, a difference of 0.17%), Sudanese (10.6%, a difference of 0.22%), and Venezuelan (10.6%, a difference of 0.22%).
| Demographics | Rating | Rank | Unemployment Among Youth under 25 years |
| Immigrants | Sudan | 100.0 /100 | #12 | Exceptional 10.5% |
| Indonesians | 100.0 /100 | #13 | Exceptional 10.6% |
| Cubans | 100.0 /100 | #14 | Exceptional 10.6% |
| Sudanese | 100.0 /100 | #15 | Exceptional 10.6% |
| Venezuelans | 100.0 /100 | #16 | Exceptional 10.6% |
| Menominee | 100.0 /100 | #17 | Exceptional 10.6% |
| Swiss | 100.0 /100 | #18 | Exceptional 10.6% |
| Immigrants | Burma/Myanmar | 100.0 /100 | #19 | Exceptional 10.6% |
| Dutch | 100.0 /100 | #20 | Exceptional 10.6% |
| Pennsylvania Germans | 100.0 /100 | #21 | Exceptional 10.6% |
| Belgians | 100.0 /100 | #22 | Exceptional 10.6% |
| Immigrants | Bosnia and Herzegovina | 100.0 /100 | #23 | Exceptional 10.6% |
| Finns | 100.0 /100 | #24 | Exceptional 10.7% |
| Immigrants | North Macedonia | 100.0 /100 | #25 | Exceptional 10.7% |
| Immigrants | India | 100.0 /100 | #26 | Exceptional 10.7% |
Demographics Similar to Immigrants from Bolivia by Unemployment Among Youth under 25 years
In terms of unemployment among youth under 25 years, the demographic groups most similar to Immigrants from Bolivia are Austrian (11.2%, a difference of 0.010%), Immigrants from Japan (11.2%, a difference of 0.010%), Kenyan (11.2%, a difference of 0.070%), Immigrants from South Africa (11.2%, a difference of 0.080%), and Immigrants from Taiwan (11.2%, a difference of 0.080%).
| Demographics | Rating | Rank | Unemployment Among Youth under 25 years |
| Bolivians | 96.1 /100 | #83 | Exceptional 11.2% |
| French Canadians | 95.9 /100 | #84 | Exceptional 11.2% |
| Immigrants | South Central Asia | 95.9 /100 | #85 | Exceptional 11.2% |
| Immigrants | South Africa | 95.8 /100 | #86 | Exceptional 11.2% |
| Kenyans | 95.7 /100 | #87 | Exceptional 11.2% |
| Austrians | 95.5 /100 | #88 | Exceptional 11.2% |
| Immigrants | Japan | 95.5 /100 | #89 | Exceptional 11.2% |
| Immigrants | Bolivia | 95.5 /100 | #90 | Exceptional 11.2% |
| Immigrants | Taiwan | 95.1 /100 | #91 | Exceptional 11.2% |
| Immigrants | Latvia | 95.1 /100 | #92 | Exceptional 11.2% |
| Immigrants | North America | 95.1 /100 | #93 | Exceptional 11.2% |
| Lithuanians | 94.8 /100 | #94 | Exceptional 11.3% |
| Carpatho Rusyns | 94.4 /100 | #95 | Exceptional 11.3% |
| Immigrants | Serbia | 94.4 /100 | #96 | Exceptional 11.3% |
| Nicaraguans | 94.3 /100 | #97 | Exceptional 11.3% |