Aleut vs Immigrants from Eritrea Unemployment Among Ages 65 to 74 years
COMPARE
Aleut
Immigrants from Eritrea
Unemployment Among Ages 65 to 74 years
Unemployment Among Ages 65 to 74 years Comparison
Aleuts
Immigrants from Eritrea
5.9%
UNEMPLOYMENT AMONG AGES 65 TO 74 YEARS
0.0/ 100
METRIC RATING
319th/ 347
METRIC RANK
4.9%
UNEMPLOYMENT AMONG AGES 65 TO 74 YEARS
100.0/ 100
METRIC RATING
21st/ 347
METRIC RANK
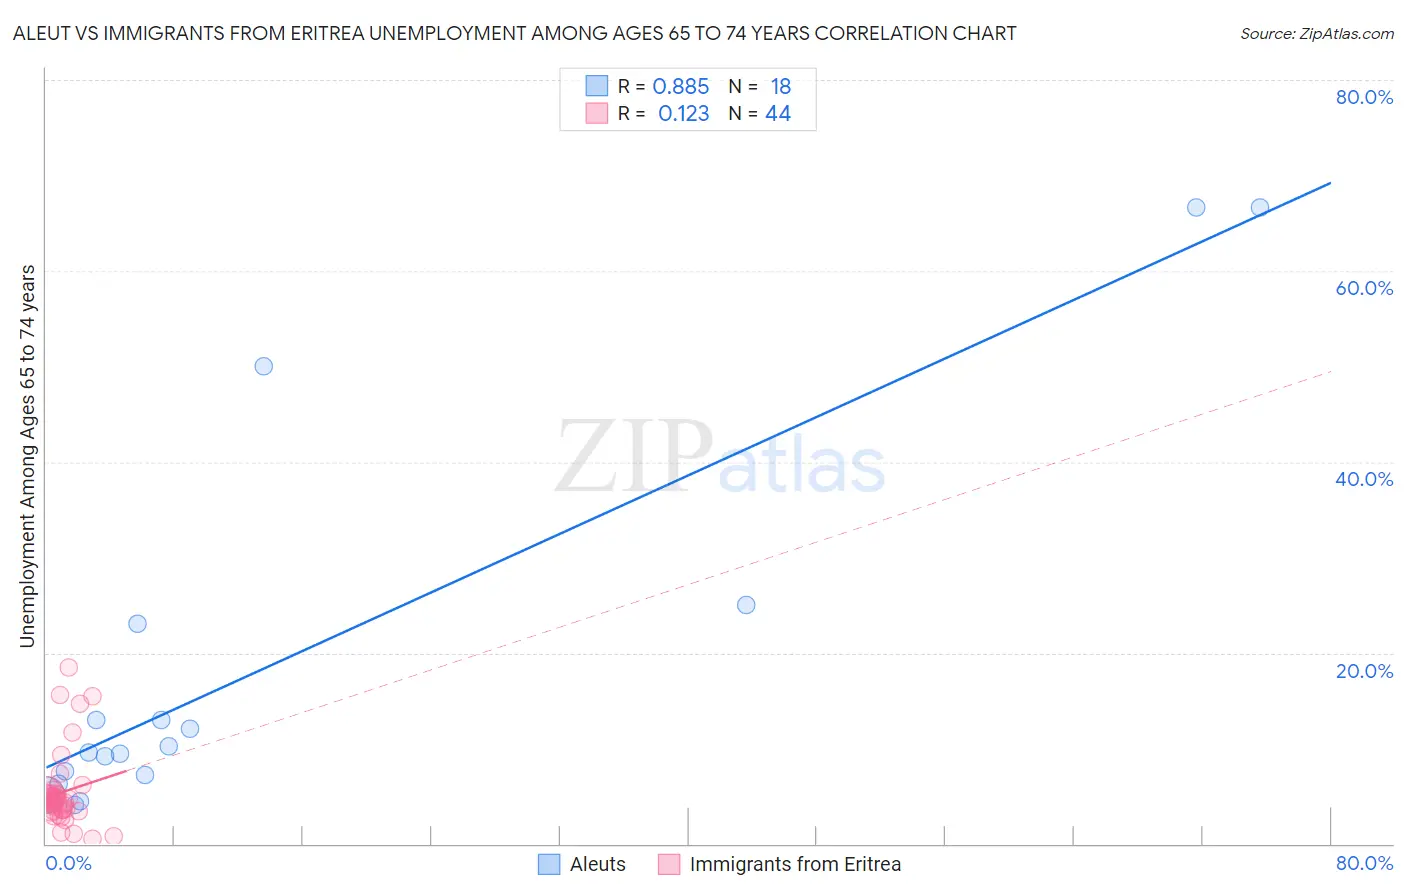
Aleut vs Immigrants from Eritrea Unemployment Among Ages 65 to 74 years Correlation Chart
The statistical analysis conducted on geographies consisting of 58,883,694 people shows a very strong positive correlation between the proportion of Aleuts and unemployment rate among population between the ages 65 and 74 in the United States with a correlation coefficient (R) of 0.885 and weighted average of 5.9%. Similarly, the statistical analysis conducted on geographies consisting of 101,478,319 people shows a poor positive correlation between the proportion of Immigrants from Eritrea and unemployment rate among population between the ages 65 and 74 in the United States with a correlation coefficient (R) of 0.123 and weighted average of 4.9%, a difference of 22.3%.
Unemployment Among Ages 65 to 74 years Correlation Summary
| Measurement | Aleut | Immigrants from Eritrea |
| Minimum | 4.1% | 0.50% |
| Maximum | 66.7% | 18.5% |
| Range | 62.6% | 18.0% |
| Mean | 19.0% | 5.4% |
| Median | 9.8% | 4.5% |
| Interquartile 25% (IQ1) | 7.2% | 3.5% |
| Interquartile 75% (IQ3) | 23.1% | 5.2% |
| Interquartile Range (IQR) | 15.9% | 1.7% |
| Standard Deviation (Sample) | 20.4% | 3.9% |
| Standard Deviation (Population) | 19.9% | 3.9% |
Similar Demographics by Unemployment Among Ages 65 to 74 years
Demographics Similar to Aleuts by Unemployment Among Ages 65 to 74 years
In terms of unemployment among ages 65 to 74 years, the demographic groups most similar to Aleuts are Zimbabwean (5.9%, a difference of 0.020%), Immigrants from Bahamas (5.9%, a difference of 0.090%), Immigrants from Central America (5.9%, a difference of 0.29%), Immigrants from Dominica (6.0%, a difference of 0.46%), and Immigrants from Mexico (6.0%, a difference of 0.68%).
| Demographics | Rating | Rank | Unemployment Among Ages 65 to 74 years |
| Hispanics or Latinos | 0.0 /100 | #312 | Tragic 5.9% |
| Vietnamese | 0.0 /100 | #313 | Tragic 5.9% |
| Immigrants | Venezuela | 0.0 /100 | #314 | Tragic 5.9% |
| Immigrants | Guatemala | 0.0 /100 | #315 | Tragic 5.9% |
| Immigrants | El Salvador | 0.0 /100 | #316 | Tragic 5.9% |
| Immigrants | Central America | 0.0 /100 | #317 | Tragic 5.9% |
| Zimbabweans | 0.0 /100 | #318 | Tragic 5.9% |
| Aleuts | 0.0 /100 | #319 | Tragic 5.9% |
| Immigrants | Bahamas | 0.0 /100 | #320 | Tragic 5.9% |
| Immigrants | Dominica | 0.0 /100 | #321 | Tragic 6.0% |
| Immigrants | Mexico | 0.0 /100 | #322 | Tragic 6.0% |
| Delaware | 0.0 /100 | #323 | Tragic 6.0% |
| Tohono O'odham | 0.0 /100 | #324 | Tragic 6.0% |
| Immigrants | Portugal | 0.0 /100 | #325 | Tragic 6.0% |
| Natives/Alaskans | 0.0 /100 | #326 | Tragic 6.0% |
Demographics Similar to Immigrants from Eritrea by Unemployment Among Ages 65 to 74 years
In terms of unemployment among ages 65 to 74 years, the demographic groups most similar to Immigrants from Eritrea are Immigrants from Zaire (4.8%, a difference of 0.38%), Menominee (4.8%, a difference of 0.64%), Creek (4.8%, a difference of 0.69%), Lebanese (4.9%, a difference of 0.75%), and Kenyan (4.8%, a difference of 0.76%).
| Demographics | Rating | Rank | Unemployment Among Ages 65 to 74 years |
| Cubans | 100.0 /100 | #14 | Exceptional 4.8% |
| Immigrants | North Macedonia | 100.0 /100 | #15 | Exceptional 4.8% |
| Immigrants | Burma/Myanmar | 100.0 /100 | #16 | Exceptional 4.8% |
| Kenyans | 100.0 /100 | #17 | Exceptional 4.8% |
| Creek | 100.0 /100 | #18 | Exceptional 4.8% |
| Menominee | 100.0 /100 | #19 | Exceptional 4.8% |
| Immigrants | Zaire | 100.0 /100 | #20 | Exceptional 4.8% |
| Immigrants | Eritrea | 100.0 /100 | #21 | Exceptional 4.9% |
| Lebanese | 100.0 /100 | #22 | Exceptional 4.9% |
| Immigrants | Nepal | 100.0 /100 | #23 | Exceptional 4.9% |
| Iraqis | 100.0 /100 | #24 | Exceptional 4.9% |
| Macedonians | 100.0 /100 | #25 | Exceptional 5.0% |
| Czechs | 100.0 /100 | #26 | Exceptional 5.0% |
| Norwegians | 100.0 /100 | #27 | Exceptional 5.0% |
| Bulgarians | 100.0 /100 | #28 | Exceptional 5.0% |