Immigrants from St. Vincent and the Grenadines vs Immigrants from Belize Unemployment Among Ages 65 to 74 years
COMPARE
Immigrants from St. Vincent and the Grenadines
Immigrants from Belize
Unemployment Among Ages 65 to 74 years
Unemployment Among Ages 65 to 74 years Comparison
Immigrants from St. Vincent and the Grenadines
Immigrants from Belize
5.6%
UNEMPLOYMENT AMONG AGES 65 TO 74 YEARS
0.2/ 100
METRIC RATING
262nd/ 347
METRIC RANK
5.5%
UNEMPLOYMENT AMONG AGES 65 TO 74 YEARS
2.2/ 100
METRIC RATING
237th/ 347
METRIC RANK
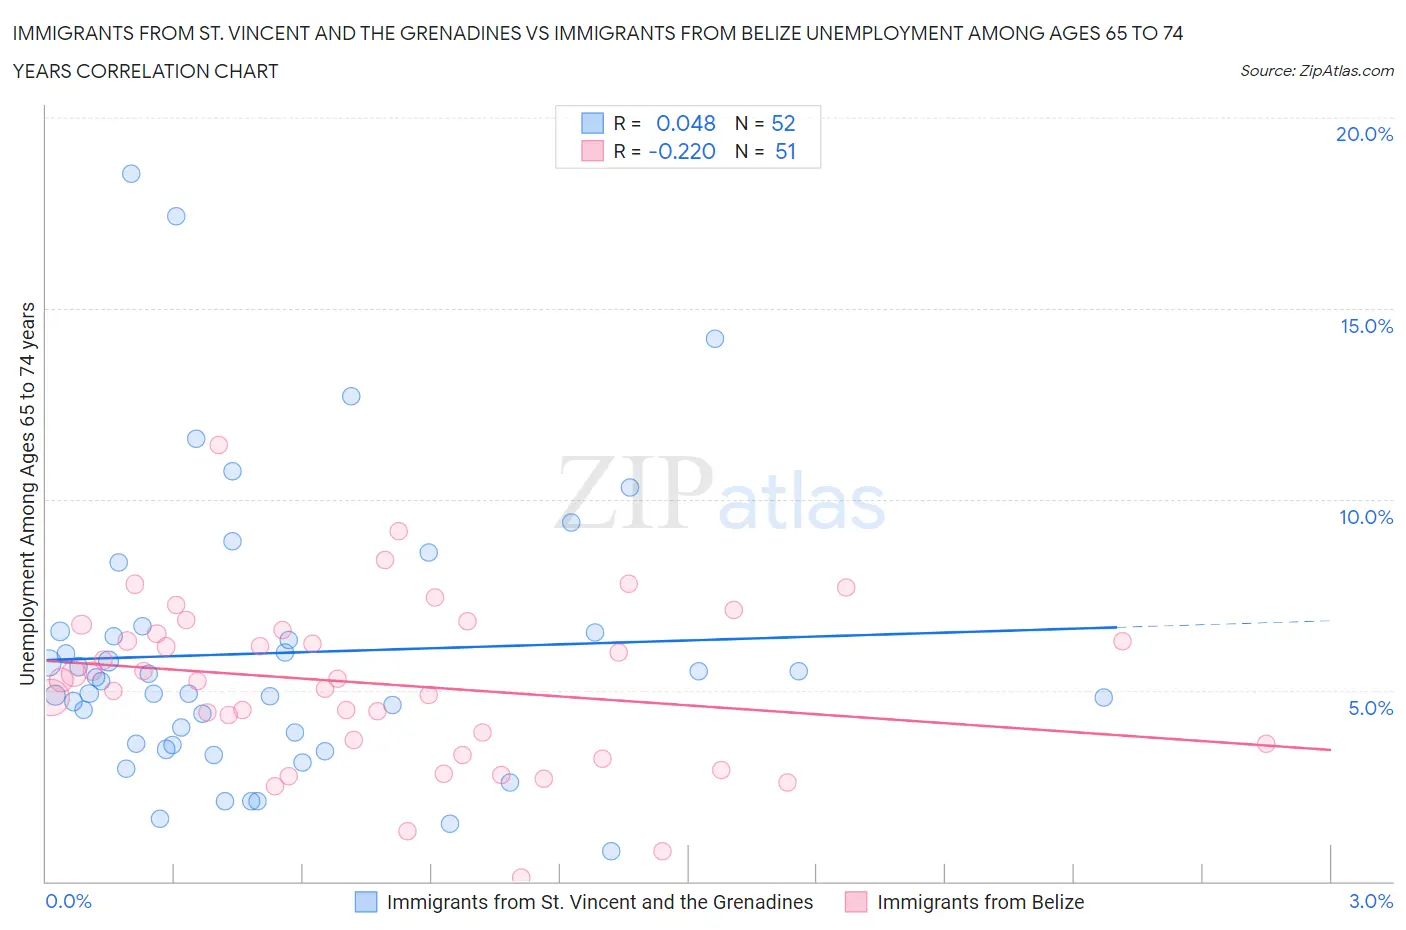
Immigrants from St. Vincent and the Grenadines vs Immigrants from Belize Unemployment Among Ages 65 to 74 years Correlation Chart
The statistical analysis conducted on geographies consisting of 54,487,393 people shows no correlation between the proportion of Immigrants from St. Vincent and the Grenadines and unemployment rate among population between the ages 65 and 74 in the United States with a correlation coefficient (R) of 0.048 and weighted average of 5.6%. Similarly, the statistical analysis conducted on geographies consisting of 124,538,788 people shows a weak negative correlation between the proportion of Immigrants from Belize and unemployment rate among population between the ages 65 and 74 in the United States with a correlation coefficient (R) of -0.220 and weighted average of 5.5%, a difference of 1.9%.
Unemployment Among Ages 65 to 74 years Correlation Summary
| Measurement | Immigrants from St. Vincent and the Grenadines | Immigrants from Belize |
| Minimum | 0.80% | 0.10% |
| Maximum | 18.5% | 11.4% |
| Range | 17.7% | 11.3% |
| Mean | 6.0% | 5.2% |
| Median | 5.1% | 5.3% |
| Interquartile 25% (IQ1) | 3.6% | 3.6% |
| Interquartile 75% (IQ3) | 6.5% | 6.6% |
| Interquartile Range (IQR) | 2.9% | 3.0% |
| Standard Deviation (Sample) | 3.7% | 2.2% |
| Standard Deviation (Population) | 3.7% | 2.2% |
Similar Demographics by Unemployment Among Ages 65 to 74 years
Demographics Similar to Immigrants from St. Vincent and the Grenadines by Unemployment Among Ages 65 to 74 years
In terms of unemployment among ages 65 to 74 years, the demographic groups most similar to Immigrants from St. Vincent and the Grenadines are Immigrants from Jamaica (5.6%, a difference of 0.010%), Pueblo (5.6%, a difference of 0.020%), South American (5.6%, a difference of 0.050%), Jamaican (5.6%, a difference of 0.060%), and Immigrants from Barbados (5.6%, a difference of 0.090%).
| Demographics | Rating | Rank | Unemployment Among Ages 65 to 74 years |
| Immigrants | Haiti | 0.4 /100 | #255 | Tragic 5.6% |
| Native Hawaiians | 0.4 /100 | #256 | Tragic 5.6% |
| Immigrants | Southern Europe | 0.3 /100 | #257 | Tragic 5.6% |
| Immigrants | Western Africa | 0.3 /100 | #258 | Tragic 5.6% |
| Sierra Leoneans | 0.2 /100 | #259 | Tragic 5.6% |
| Immigrants | Barbados | 0.2 /100 | #260 | Tragic 5.6% |
| South Americans | 0.2 /100 | #261 | Tragic 5.6% |
| Immigrants | St. Vincent and the Grenadines | 0.2 /100 | #262 | Tragic 5.6% |
| Immigrants | Jamaica | 0.2 /100 | #263 | Tragic 5.6% |
| Pueblo | 0.2 /100 | #264 | Tragic 5.6% |
| Jamaicans | 0.2 /100 | #265 | Tragic 5.6% |
| French Canadians | 0.2 /100 | #266 | Tragic 5.6% |
| Guyanese | 0.2 /100 | #267 | Tragic 5.6% |
| Hawaiians | 0.2 /100 | #268 | Tragic 5.7% |
| Immigrants | Colombia | 0.1 /100 | #269 | Tragic 5.7% |
Demographics Similar to Immigrants from Belize by Unemployment Among Ages 65 to 74 years
In terms of unemployment among ages 65 to 74 years, the demographic groups most similar to Immigrants from Belize are Hopi (5.5%, a difference of 0.0%), Peruvian (5.5%, a difference of 0.010%), French American Indian (5.5%, a difference of 0.020%), South American Indian (5.5%, a difference of 0.030%), and Nigerian (5.5%, a difference of 0.12%).
| Demographics | Rating | Rank | Unemployment Among Ages 65 to 74 years |
| Immigrants | Caribbean | 2.7 /100 | #230 | Tragic 5.5% |
| Israelis | 2.5 /100 | #231 | Tragic 5.5% |
| Nigerians | 2.5 /100 | #232 | Tragic 5.5% |
| South American Indians | 2.3 /100 | #233 | Tragic 5.5% |
| French American Indians | 2.2 /100 | #234 | Tragic 5.5% |
| Peruvians | 2.2 /100 | #235 | Tragic 5.5% |
| Hopi | 2.2 /100 | #236 | Tragic 5.5% |
| Immigrants | Belize | 2.2 /100 | #237 | Tragic 5.5% |
| Cajuns | 1.8 /100 | #238 | Tragic 5.5% |
| German Russians | 1.6 /100 | #239 | Tragic 5.5% |
| Ghanaians | 1.4 /100 | #240 | Tragic 5.6% |
| Cree | 1.4 /100 | #241 | Tragic 5.6% |
| Immigrants | Ghana | 1.4 /100 | #242 | Tragic 5.6% |
| Immigrants | Peru | 1.3 /100 | #243 | Tragic 5.6% |
| Immigrants | Micronesia | 0.9 /100 | #244 | Tragic 5.6% |