Colombian vs Immigrants from Belize Unemployment Among Ages 65 to 74 years
COMPARE
Colombian
Immigrants from Belize
Unemployment Among Ages 65 to 74 years
Unemployment Among Ages 65 to 74 years Comparison
Colombians
Immigrants from Belize
5.6%
UNEMPLOYMENT AMONG AGES 65 TO 74 YEARS
0.5/ 100
METRIC RATING
252nd/ 347
METRIC RANK
5.5%
UNEMPLOYMENT AMONG AGES 65 TO 74 YEARS
2.2/ 100
METRIC RATING
237th/ 347
METRIC RANK
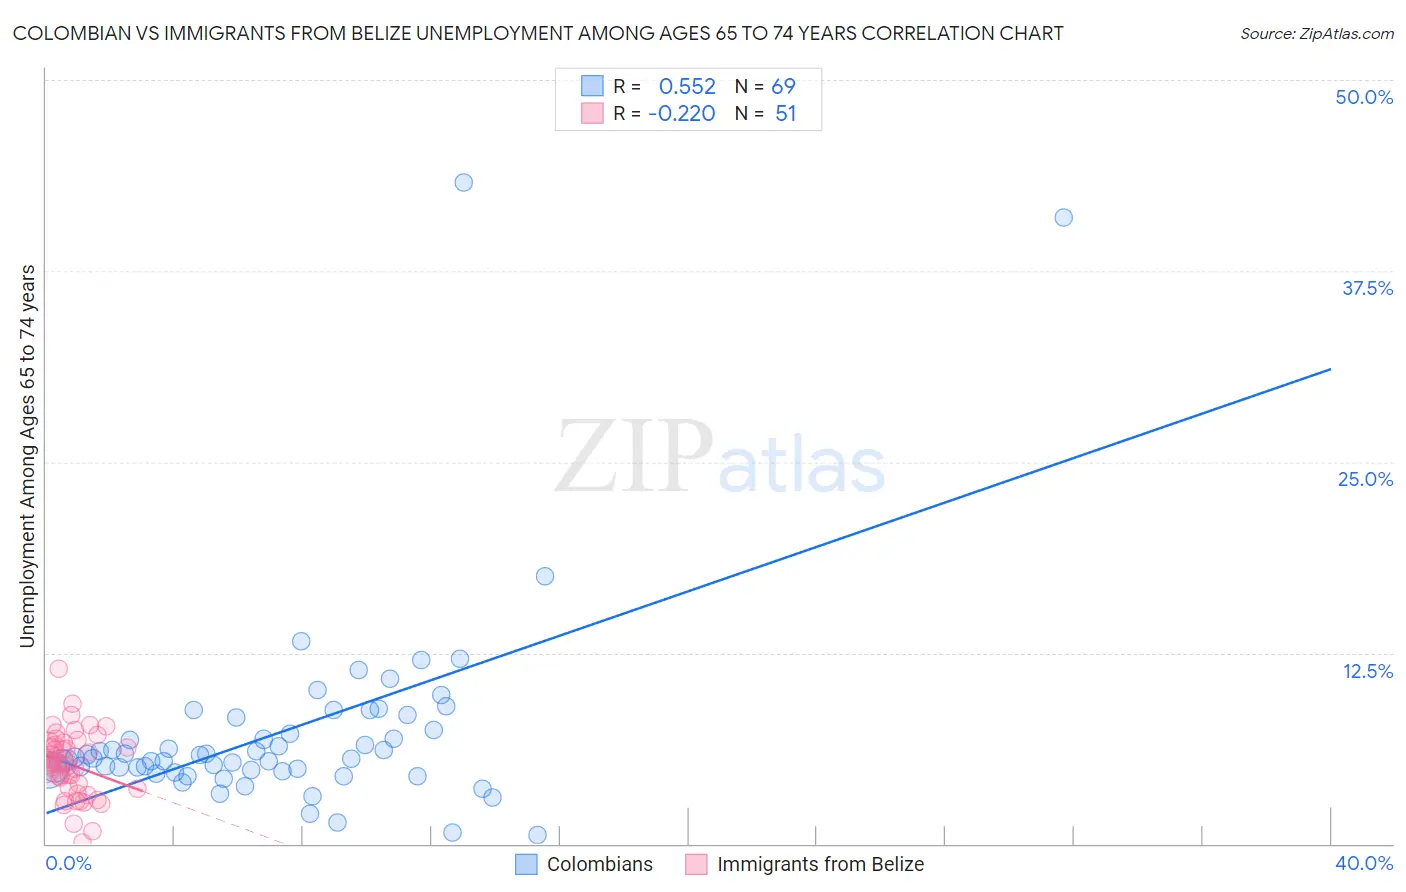
Colombian vs Immigrants from Belize Unemployment Among Ages 65 to 74 years Correlation Chart
The statistical analysis conducted on geographies consisting of 369,038,352 people shows a substantial positive correlation between the proportion of Colombians and unemployment rate among population between the ages 65 and 74 in the United States with a correlation coefficient (R) of 0.552 and weighted average of 5.6%. Similarly, the statistical analysis conducted on geographies consisting of 124,538,788 people shows a weak negative correlation between the proportion of Immigrants from Belize and unemployment rate among population between the ages 65 and 74 in the United States with a correlation coefficient (R) of -0.220 and weighted average of 5.5%, a difference of 1.2%.
Unemployment Among Ages 65 to 74 years Correlation Summary
| Measurement | Colombian | Immigrants from Belize |
| Minimum | 0.60% | 0.10% |
| Maximum | 43.3% | 11.4% |
| Range | 42.7% | 11.3% |
| Mean | 7.2% | 5.2% |
| Median | 5.6% | 5.3% |
| Interquartile 25% (IQ1) | 4.8% | 3.6% |
| Interquartile 75% (IQ3) | 7.9% | 6.6% |
| Interquartile Range (IQR) | 3.1% | 3.0% |
| Standard Deviation (Sample) | 6.7% | 2.2% |
| Standard Deviation (Population) | 6.7% | 2.2% |
Demographics Similar to Colombians and Immigrants from Belize by Unemployment Among Ages 65 to 74 years
In terms of unemployment among ages 65 to 74 years, the demographic groups most similar to Colombians are Brazilian (5.6%, a difference of 0.040%), Immigrants from Brazil (5.6%, a difference of 0.060%), Immigrants from Costa Rica (5.6%, a difference of 0.080%), Cape Verdean (5.6%, a difference of 0.29%), and Trinidadian and Tobagonian (5.6%, a difference of 0.37%). Similarly, the demographic groups most similar to Immigrants from Belize are Hopi (5.5%, a difference of 0.0%), Peruvian (5.5%, a difference of 0.010%), French American Indian (5.5%, a difference of 0.020%), Cajun (5.5%, a difference of 0.16%), and German Russian (5.5%, a difference of 0.24%).
| Demographics | Rating | Rank | Unemployment Among Ages 65 to 74 years |
| French American Indians | 2.2 /100 | #234 | Tragic 5.5% |
| Peruvians | 2.2 /100 | #235 | Tragic 5.5% |
| Hopi | 2.2 /100 | #236 | Tragic 5.5% |
| Immigrants | Belize | 2.2 /100 | #237 | Tragic 5.5% |
| Cajuns | 1.8 /100 | #238 | Tragic 5.5% |
| German Russians | 1.6 /100 | #239 | Tragic 5.5% |
| Ghanaians | 1.4 /100 | #240 | Tragic 5.6% |
| Cree | 1.4 /100 | #241 | Tragic 5.6% |
| Immigrants | Ghana | 1.4 /100 | #242 | Tragic 5.6% |
| Immigrants | Peru | 1.3 /100 | #243 | Tragic 5.6% |
| Immigrants | Micronesia | 0.9 /100 | #244 | Tragic 5.6% |
| Immigrants | Greece | 0.9 /100 | #245 | Tragic 5.6% |
| Paraguayans | 0.9 /100 | #246 | Tragic 5.6% |
| Immigrants | Immigrants | 0.9 /100 | #247 | Tragic 5.6% |
| Immigrants | Argentina | 0.9 /100 | #248 | Tragic 5.6% |
| Trinidadians and Tobagonians | 0.8 /100 | #249 | Tragic 5.6% |
| Cape Verdeans | 0.7 /100 | #250 | Tragic 5.6% |
| Brazilians | 0.5 /100 | #251 | Tragic 5.6% |
| Colombians | 0.5 /100 | #252 | Tragic 5.6% |
| Immigrants | Brazil | 0.5 /100 | #253 | Tragic 5.6% |
| Immigrants | Costa Rica | 0.5 /100 | #254 | Tragic 5.6% |