Aleut vs Puerto Rican Unemployment Among Ages 30 to 34 years
COMPARE
Aleut
Puerto Rican
Unemployment Among Ages 30 to 34 years
Unemployment Among Ages 30 to 34 years Comparison
Aleuts
Puerto Ricans
7.1%
UNEMPLOYMENT AMONG AGES 30 TO 34 YEARS
0.0/ 100
METRIC RATING
315th/ 347
METRIC RANK
8.9%
UNEMPLOYMENT AMONG AGES 30 TO 34 YEARS
0.0/ 100
METRIC RATING
335th/ 347
METRIC RANK
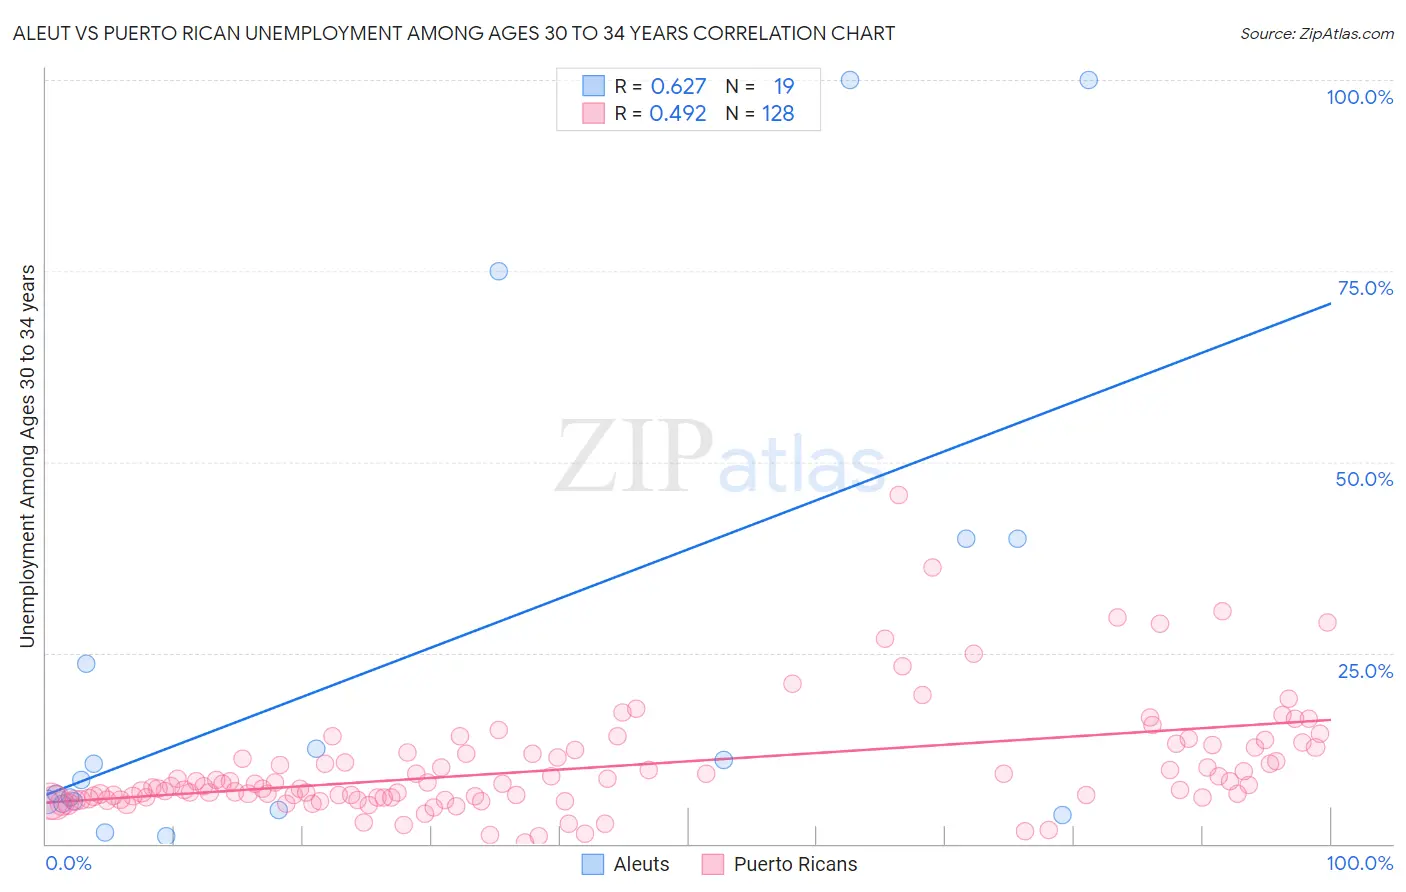
Aleut vs Puerto Rican Unemployment Among Ages 30 to 34 years Correlation Chart
The statistical analysis conducted on geographies consisting of 60,709,035 people shows a significant positive correlation between the proportion of Aleuts and unemployment rate among population between the ages 30 and 34 in the United States with a correlation coefficient (R) of 0.627 and weighted average of 7.1%. Similarly, the statistical analysis conducted on geographies consisting of 479,130,196 people shows a moderate positive correlation between the proportion of Puerto Ricans and unemployment rate among population between the ages 30 and 34 in the United States with a correlation coefficient (R) of 0.492 and weighted average of 8.9%, a difference of 25.3%.
Unemployment Among Ages 30 to 34 years Correlation Summary
| Measurement | Aleut | Puerto Rican |
| Minimum | 1.0% | 0.20% |
| Maximum | 100.0% | 45.6% |
| Range | 99.0% | 45.4% |
| Mean | 24.2% | 10.0% |
| Median | 8.3% | 7.6% |
| Interquartile 25% (IQ1) | 5.3% | 6.0% |
| Interquartile 75% (IQ3) | 40.0% | 12.1% |
| Interquartile Range (IQR) | 34.7% | 6.1% |
| Standard Deviation (Sample) | 32.4% | 7.2% |
| Standard Deviation (Population) | 31.5% | 7.1% |
Demographics Similar to Aleuts and Puerto Ricans by Unemployment Among Ages 30 to 34 years
In terms of unemployment among ages 30 to 34 years, the demographic groups most similar to Aleuts are Houma (7.2%, a difference of 1.0%), Immigrants from Cabo Verde (7.2%, a difference of 1.3%), Black/African American (7.2%, a difference of 1.4%), Guyanese (7.2%, a difference of 1.4%), and Cape Verdean (7.2%, a difference of 1.5%). Similarly, the demographic groups most similar to Puerto Ricans are Alaska Native (8.5%, a difference of 4.5%), Pueblo (8.3%, a difference of 7.3%), Native/Alaskan (8.2%, a difference of 7.8%), Sioux (8.0%, a difference of 10.6%), and Shoshone (7.9%, a difference of 12.2%).
| Demographics | Rating | Rank | Unemployment Among Ages 30 to 34 years |
| Aleuts | 0.0 /100 | #315 | Tragic 7.1% |
| Houma | 0.0 /100 | #316 | Tragic 7.2% |
| Immigrants | Cabo Verde | 0.0 /100 | #317 | Tragic 7.2% |
| Blacks/African Americans | 0.0 /100 | #318 | Tragic 7.2% |
| Guyanese | 0.0 /100 | #319 | Tragic 7.2% |
| Cape Verdeans | 0.0 /100 | #320 | Tragic 7.2% |
| Immigrants | Guyana | 0.0 /100 | #321 | Tragic 7.2% |
| Marshallese | 0.0 /100 | #322 | Tragic 7.2% |
| Immigrants | Yemen | 0.0 /100 | #323 | Tragic 7.3% |
| Immigrants | Dominica | 0.0 /100 | #324 | Tragic 7.3% |
| Apache | 0.0 /100 | #325 | Tragic 7.3% |
| Dominicans | 0.0 /100 | #326 | Tragic 7.7% |
| Immigrants | Dominican Republic | 0.0 /100 | #327 | Tragic 7.7% |
| Chippewa | 0.0 /100 | #328 | Tragic 7.8% |
| Cheyenne | 0.0 /100 | #329 | Tragic 7.8% |
| Shoshone | 0.0 /100 | #330 | Tragic 7.9% |
| Sioux | 0.0 /100 | #331 | Tragic 8.0% |
| Natives/Alaskans | 0.0 /100 | #332 | Tragic 8.2% |
| Pueblo | 0.0 /100 | #333 | Tragic 8.3% |
| Alaska Natives | 0.0 /100 | #334 | Tragic 8.5% |
| Puerto Ricans | 0.0 /100 | #335 | Tragic 8.9% |