Albanian vs Pakistani Female Unemployment
COMPARE
Albanian
Pakistani
Female Unemployment
Female Unemployment Comparison
Albanians
Pakistanis
5.2%
FEMALE UNEMPLOYMENT
68.3/ 100
METRIC RATING
158th/ 347
METRIC RANK
5.1%
FEMALE UNEMPLOYMENT
83.8/ 100
METRIC RATING
137th/ 347
METRIC RANK
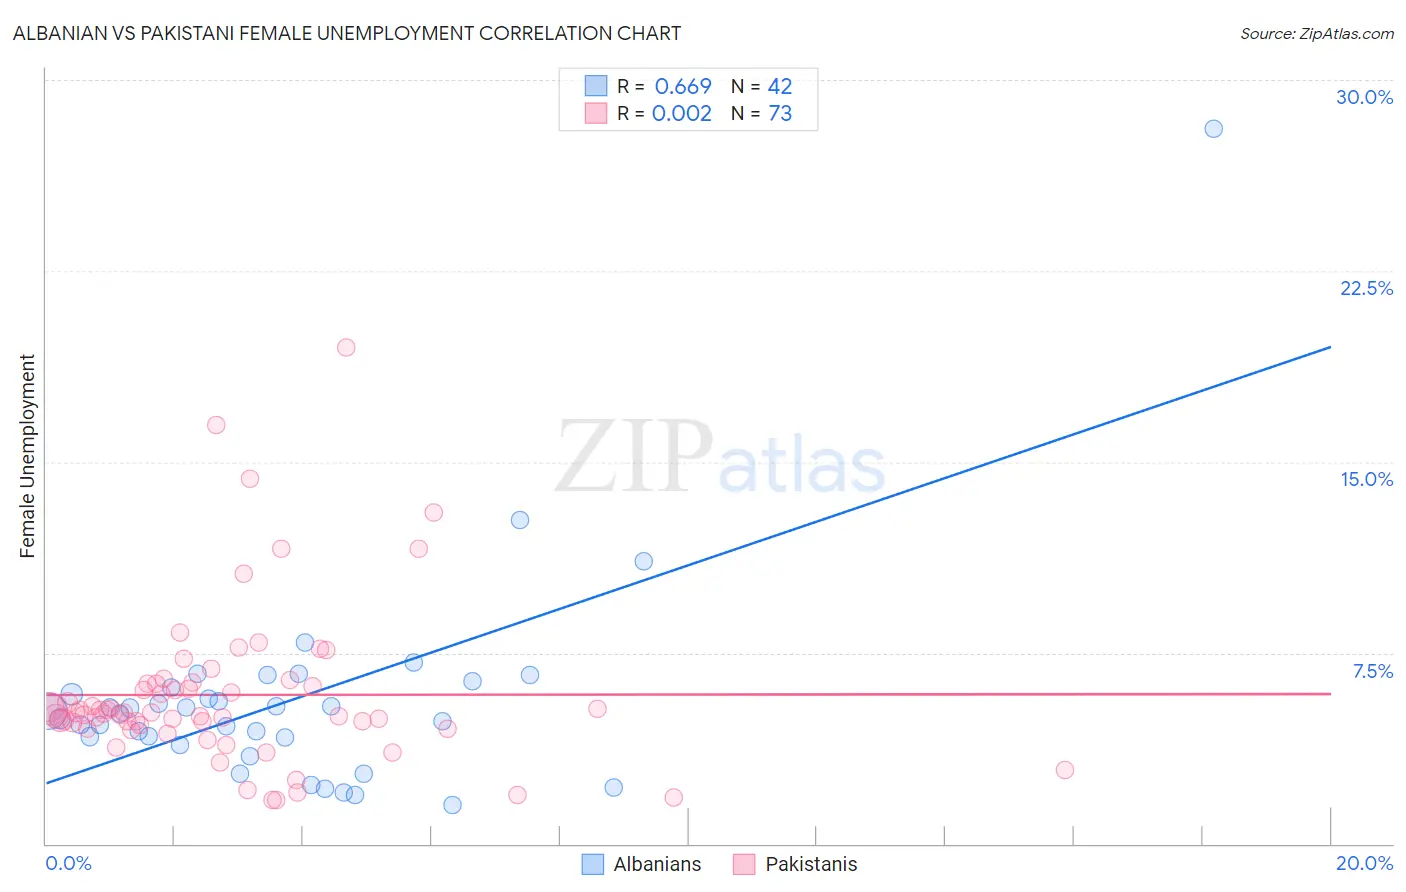
Albanian vs Pakistani Female Unemployment Correlation Chart
The statistical analysis conducted on geographies consisting of 192,822,109 people shows a significant positive correlation between the proportion of Albanians and unemploymnet rate among females in the United States with a correlation coefficient (R) of 0.669 and weighted average of 5.2%. Similarly, the statistical analysis conducted on geographies consisting of 334,292,014 people shows no correlation between the proportion of Pakistanis and unemploymnet rate among females in the United States with a correlation coefficient (R) of 0.002 and weighted average of 5.1%, a difference of 1.3%.
Female Unemployment Correlation Summary
| Measurement | Albanian | Pakistani |
| Minimum | 1.5% | 1.7% |
| Maximum | 28.1% | 19.5% |
| Range | 26.6% | 17.8% |
| Mean | 5.6% | 5.8% |
| Median | 5.2% | 5.1% |
| Interquartile 25% (IQ1) | 4.2% | 4.6% |
| Interquartile 75% (IQ3) | 6.1% | 6.3% |
| Interquartile Range (IQR) | 1.9% | 1.7% |
| Standard Deviation (Sample) | 4.2% | 3.1% |
| Standard Deviation (Population) | 4.1% | 3.1% |
Similar Demographics by Female Unemployment
Demographics Similar to Albanians by Female Unemployment
In terms of female unemployment, the demographic groups most similar to Albanians are Immigrants from Russia (5.2%, a difference of 0.070%), Immigrants from Northern Africa (5.2%, a difference of 0.10%), Immigrants from Micronesia (5.2%, a difference of 0.10%), Immigrants from Spain (5.2%, a difference of 0.11%), and Immigrants from Pakistan (5.2%, a difference of 0.11%).
| Demographics | Rating | Rank | Female Unemployment |
| Immigrants | China | 75.9 /100 | #151 | Good 5.2% |
| Immigrants | Italy | 75.0 /100 | #152 | Good 5.2% |
| Immigrants | Greece | 74.9 /100 | #153 | Good 5.2% |
| South Africans | 70.8 /100 | #154 | Good 5.2% |
| Immigrants | Egypt | 70.0 /100 | #155 | Good 5.2% |
| Immigrants | Northern Africa | 69.6 /100 | #156 | Good 5.2% |
| Immigrants | Russia | 69.3 /100 | #157 | Good 5.2% |
| Albanians | 68.3 /100 | #158 | Good 5.2% |
| Immigrants | Micronesia | 66.9 /100 | #159 | Good 5.2% |
| Immigrants | Spain | 66.8 /100 | #160 | Good 5.2% |
| Immigrants | Pakistan | 66.7 /100 | #161 | Good 5.2% |
| Potawatomi | 65.9 /100 | #162 | Good 5.2% |
| Immigrants | Asia | 64.3 /100 | #163 | Good 5.2% |
| Bangladeshis | 64.3 /100 | #164 | Good 5.2% |
| Syrians | 62.8 /100 | #165 | Good 5.2% |
Demographics Similar to Pakistanis by Female Unemployment
In terms of female unemployment, the demographic groups most similar to Pakistanis are Indian (Asian) (5.1%, a difference of 0.040%), Chickasaw (5.1%, a difference of 0.060%), Immigrants from Eastern Asia (5.1%, a difference of 0.080%), Immigrants from Eritrea (5.1%, a difference of 0.090%), and Immigrants from Latvia (5.1%, a difference of 0.090%).
| Demographics | Rating | Rank | Female Unemployment |
| Maltese | 85.5 /100 | #130 | Excellent 5.1% |
| Immigrants | Ethiopia | 85.4 /100 | #131 | Excellent 5.1% |
| Immigrants | Sri Lanka | 85.0 /100 | #132 | Excellent 5.1% |
| Immigrants | Hong Kong | 84.8 /100 | #133 | Excellent 5.1% |
| Immigrants | Eritrea | 84.6 /100 | #134 | Excellent 5.1% |
| Immigrants | Latvia | 84.6 /100 | #135 | Excellent 5.1% |
| Indians (Asian) | 84.2 /100 | #136 | Excellent 5.1% |
| Pakistanis | 83.8 /100 | #137 | Excellent 5.1% |
| Chickasaw | 83.2 /100 | #138 | Excellent 5.1% |
| Immigrants | Eastern Asia | 83.0 /100 | #139 | Excellent 5.1% |
| Immigrants | France | 82.7 /100 | #140 | Excellent 5.1% |
| Immigrants | Eastern Europe | 81.5 /100 | #141 | Excellent 5.1% |
| Palestinians | 80.8 /100 | #142 | Excellent 5.1% |
| Immigrants | Kazakhstan | 80.7 /100 | #143 | Excellent 5.1% |
| Immigrants | Jordan | 80.4 /100 | #144 | Excellent 5.1% |