Albanian vs Basque Unemployment
COMPARE
Albanian
Basque
Unemployment
Unemployment Comparison
Albanians
Basques
5.3%
UNEMPLOYMENT
43.5/ 100
METRIC RATING
181st/ 347
METRIC RANK
5.0%
UNEMPLOYMENT
97.6/ 100
METRIC RATING
81st/ 347
METRIC RANK
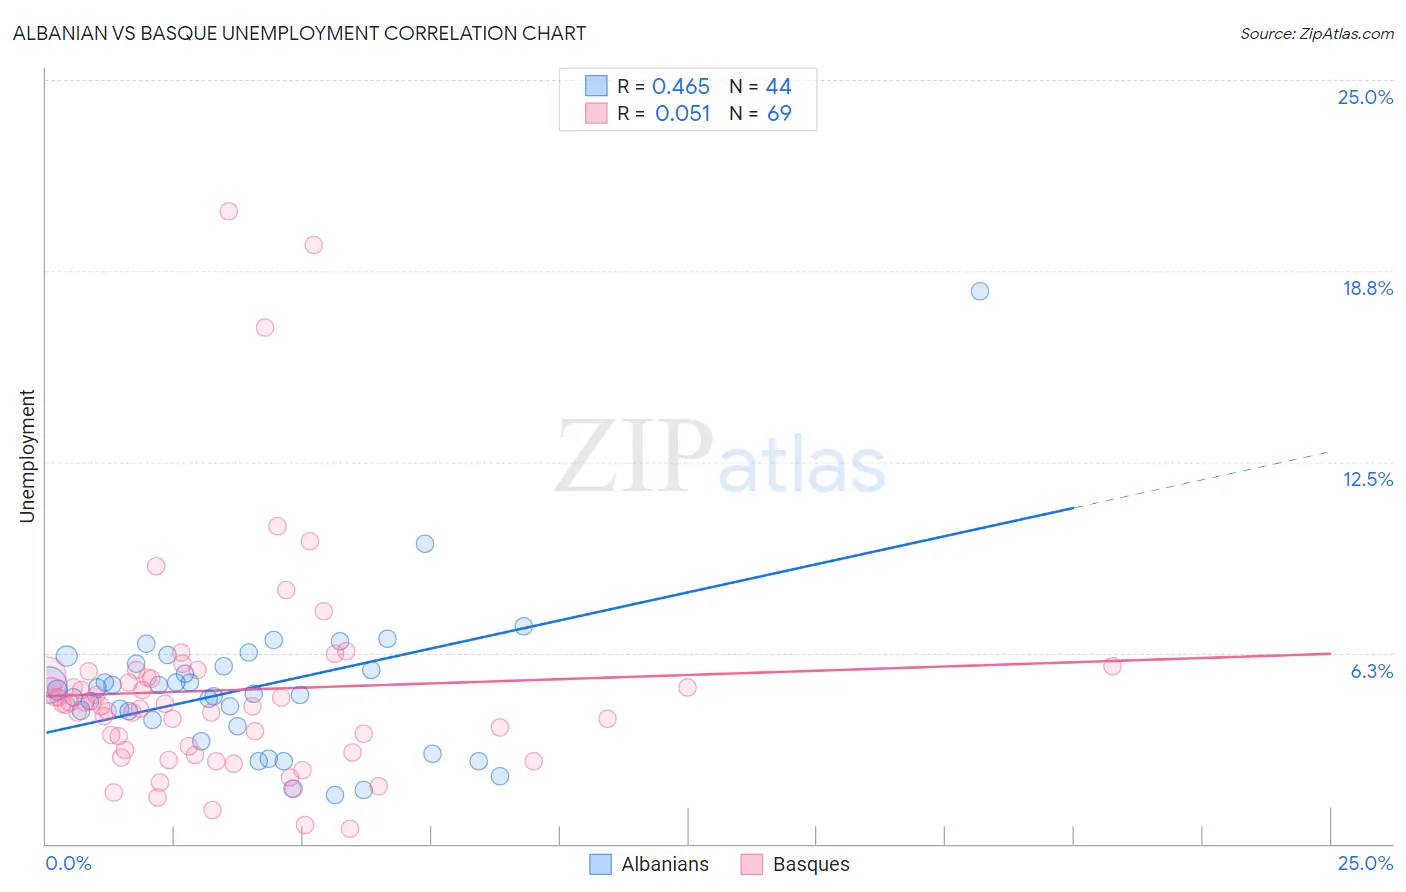
Albanian vs Basque Unemployment Correlation Chart
The statistical analysis conducted on geographies consisting of 193,192,557 people shows a moderate positive correlation between the proportion of Albanians and unemployment in the United States with a correlation coefficient (R) of 0.465 and weighted average of 5.3%. Similarly, the statistical analysis conducted on geographies consisting of 165,724,344 people shows a slight positive correlation between the proportion of Basques and unemployment in the United States with a correlation coefficient (R) of 0.051 and weighted average of 5.0%, a difference of 6.5%.
Unemployment Correlation Summary
| Measurement | Albanian | Basque |
| Minimum | 1.6% | 0.50% |
| Maximum | 18.1% | 20.7% |
| Range | 16.5% | 20.2% |
| Mean | 5.1% | 5.0% |
| Median | 5.0% | 4.5% |
| Interquartile 25% (IQ1) | 3.9% | 3.0% |
| Interquartile 75% (IQ3) | 5.8% | 5.5% |
| Interquartile Range (IQR) | 1.9% | 2.5% |
| Standard Deviation (Sample) | 2.6% | 3.6% |
| Standard Deviation (Population) | 2.6% | 3.6% |
Similar Demographics by Unemployment
Demographics Similar to Albanians by Unemployment
In terms of unemployment, the demographic groups most similar to Albanians are Spaniard (5.3%, a difference of 0.080%), Immigrants from Greece (5.3%, a difference of 0.090%), Malaysian (5.3%, a difference of 0.21%), Brazilian (5.3%, a difference of 0.21%), and Afghan (5.3%, a difference of 0.24%).
| Demographics | Rating | Rank | Unemployment |
| Immigrants | Congo | 50.0 /100 | #174 | Average 5.3% |
| Taiwanese | 49.6 /100 | #175 | Average 5.3% |
| Nicaraguans | 48.7 /100 | #176 | Average 5.3% |
| Immigrants | Nonimmigrants | 47.9 /100 | #177 | Average 5.3% |
| Afghans | 47.4 /100 | #178 | Average 5.3% |
| Malaysians | 46.8 /100 | #179 | Average 5.3% |
| Immigrants | Greece | 45.0 /100 | #180 | Average 5.3% |
| Albanians | 43.5 /100 | #181 | Average 5.3% |
| Spaniards | 42.2 /100 | #182 | Average 5.3% |
| Brazilians | 40.2 /100 | #183 | Average 5.3% |
| Assyrians/Chaldeans/Syriacs | 39.2 /100 | #184 | Fair 5.3% |
| Immigrants | Thailand | 38.9 /100 | #185 | Fair 5.3% |
| Immigrants | Uganda | 37.8 /100 | #186 | Fair 5.3% |
| Costa Ricans | 37.4 /100 | #187 | Fair 5.3% |
| Alsatians | 37.0 /100 | #188 | Fair 5.3% |
Demographics Similar to Basques by Unemployment
In terms of unemployment, the demographic groups most similar to Basques are Immigrants from Sweden (5.0%, a difference of 0.010%), Fijian (5.0%, a difference of 0.010%), Hmong (5.0%, a difference of 0.020%), Canadian (5.0%, a difference of 0.080%), and Russian (5.0%, a difference of 0.10%).
| Demographics | Rating | Rank | Unemployment |
| Immigrants | Northern Europe | 98.2 /100 | #74 | Exceptional 4.9% |
| Turks | 98.0 /100 | #75 | Exceptional 4.9% |
| German Russians | 98.0 /100 | #76 | Exceptional 4.9% |
| Cypriots | 97.9 /100 | #77 | Exceptional 4.9% |
| Okinawans | 97.9 /100 | #78 | Exceptional 4.9% |
| Canadians | 97.7 /100 | #79 | Exceptional 5.0% |
| Immigrants | Sweden | 97.6 /100 | #80 | Exceptional 5.0% |
| Basques | 97.6 /100 | #81 | Exceptional 5.0% |
| Fijians | 97.6 /100 | #82 | Exceptional 5.0% |
| Hmong | 97.6 /100 | #83 | Exceptional 5.0% |
| Russians | 97.4 /100 | #84 | Exceptional 5.0% |
| Immigrants | Australia | 97.0 /100 | #85 | Exceptional 5.0% |
| Hungarians | 96.9 /100 | #86 | Exceptional 5.0% |
| Immigrants | Moldova | 96.6 /100 | #87 | Exceptional 5.0% |
| Immigrants | Korea | 96.6 /100 | #88 | Exceptional 5.0% |