Immigrants from Kenya vs Immigrants from Morocco Male Unemployment
COMPARE
Immigrants from Kenya
Immigrants from Morocco
Male Unemployment
Male Unemployment Comparison
Immigrants from Kenya
Immigrants from Morocco
5.2%
MALE UNEMPLOYMENT
77.6/ 100
METRIC RATING
146th/ 347
METRIC RANK
5.3%
MALE UNEMPLOYMENT
60.2/ 100
METRIC RATING
166th/ 347
METRIC RANK
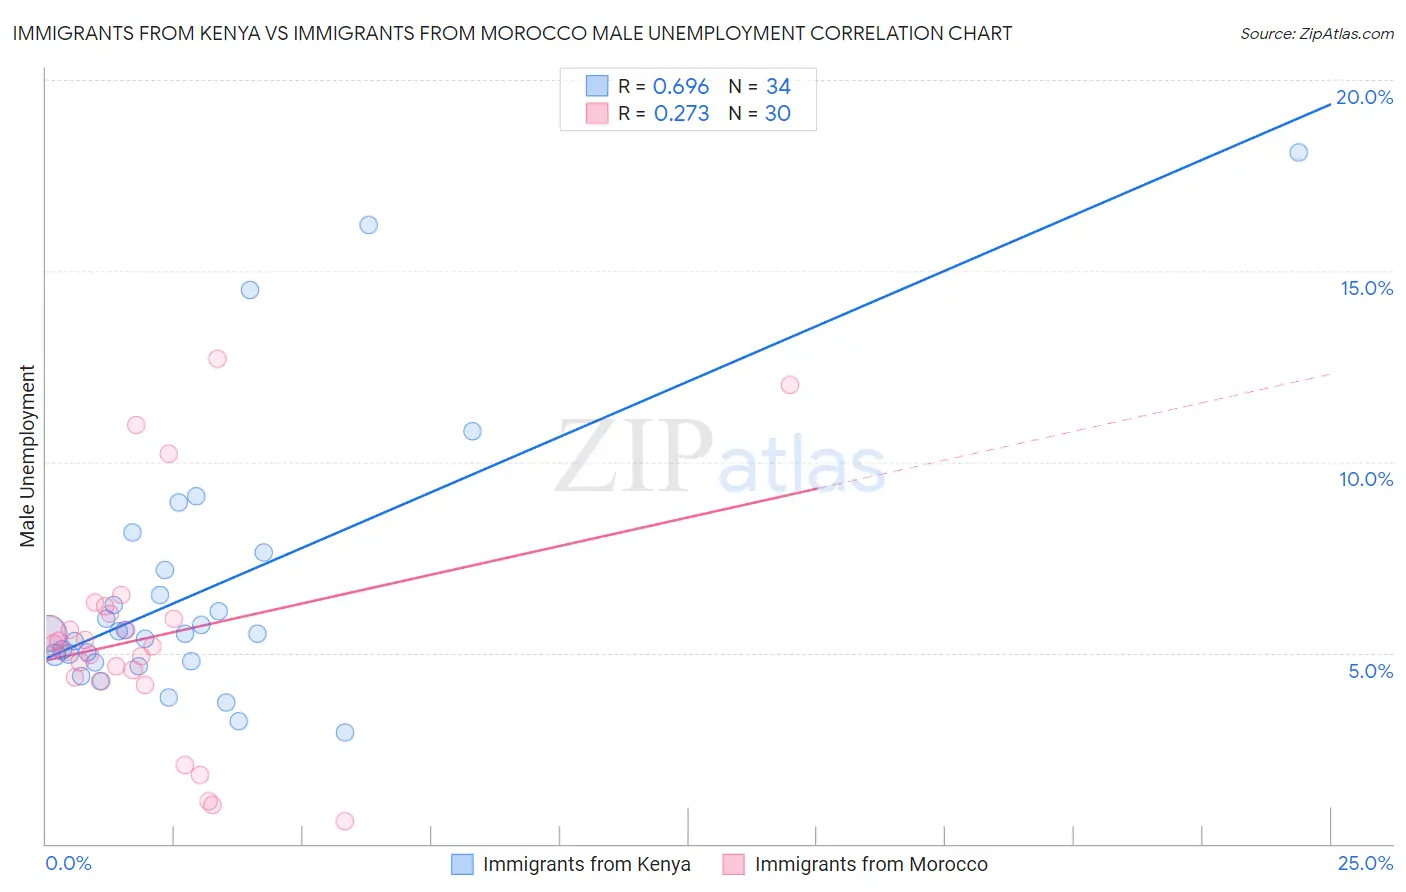
Immigrants from Kenya vs Immigrants from Morocco Male Unemployment Correlation Chart
The statistical analysis conducted on geographies consisting of 217,767,136 people shows a significant positive correlation between the proportion of Immigrants from Kenya and unemployment rate among males in the United States with a correlation coefficient (R) of 0.696 and weighted average of 5.2%. Similarly, the statistical analysis conducted on geographies consisting of 178,783,560 people shows a weak positive correlation between the proportion of Immigrants from Morocco and unemployment rate among males in the United States with a correlation coefficient (R) of 0.273 and weighted average of 5.3%, a difference of 1.2%.
Male Unemployment Correlation Summary
| Measurement | Immigrants from Kenya | Immigrants from Morocco |
| Minimum | 2.9% | 0.60% |
| Maximum | 18.1% | 12.7% |
| Range | 15.2% | 12.1% |
| Mean | 6.6% | 5.4% |
| Median | 5.5% | 5.2% |
| Interquartile 25% (IQ1) | 4.8% | 4.4% |
| Interquartile 75% (IQ3) | 7.2% | 6.0% |
| Interquartile Range (IQR) | 2.4% | 1.6% |
| Standard Deviation (Sample) | 3.5% | 2.9% |
| Standard Deviation (Population) | 3.4% | 2.9% |
Demographics Similar to Immigrants from Kenya and Immigrants from Morocco by Male Unemployment
In terms of male unemployment, the demographic groups most similar to Immigrants from Kenya are Immigrants from Burma/Myanmar (5.2%, a difference of 0.010%), Immigrants from Italy (5.2%, a difference of 0.11%), Immigrants from Europe (5.2%, a difference of 0.12%), Indian (Asian) (5.2%, a difference of 0.14%), and Slovak (5.2%, a difference of 0.17%). Similarly, the demographic groups most similar to Immigrants from Morocco are South American (5.3%, a difference of 0.030%), Afghan (5.3%, a difference of 0.11%), Immigrants from Hong Kong (5.2%, a difference of 0.35%), Immigrants from Egypt (5.2%, a difference of 0.36%), and Immigrants from China (5.2%, a difference of 0.69%).
| Demographics | Rating | Rank | Male Unemployment |
| Immigrants | Kenya | 77.6 /100 | #146 | Good 5.2% |
| Immigrants | Burma/Myanmar | 77.5 /100 | #147 | Good 5.2% |
| Immigrants | Italy | 76.3 /100 | #148 | Good 5.2% |
| Immigrants | Europe | 76.2 /100 | #149 | Good 5.2% |
| Indians (Asian) | 76.0 /100 | #150 | Good 5.2% |
| Slovaks | 75.5 /100 | #151 | Good 5.2% |
| Egyptians | 74.8 /100 | #152 | Good 5.2% |
| Immigrants | Uruguay | 73.9 /100 | #153 | Good 5.2% |
| Laotians | 73.8 /100 | #154 | Good 5.2% |
| Immigrants | Hungary | 73.4 /100 | #155 | Good 5.2% |
| Americans | 72.7 /100 | #156 | Good 5.2% |
| Immigrants | Northern Africa | 72.3 /100 | #157 | Good 5.2% |
| Immigrants | Indonesia | 71.5 /100 | #158 | Good 5.2% |
| Indonesians | 71.2 /100 | #159 | Good 5.2% |
| Immigrants | Norway | 71.0 /100 | #160 | Good 5.2% |
| Immigrants | China | 70.6 /100 | #161 | Good 5.2% |
| Immigrants | Egypt | 65.9 /100 | #162 | Good 5.2% |
| Immigrants | Hong Kong | 65.7 /100 | #163 | Good 5.2% |
| Afghans | 62.0 /100 | #164 | Good 5.3% |
| South Americans | 60.6 /100 | #165 | Good 5.3% |
| Immigrants | Morocco | 60.2 /100 | #166 | Good 5.3% |