Slovene vs Immigrants from Morocco Male Unemployment
COMPARE
Slovene
Immigrants from Morocco
Male Unemployment
Male Unemployment Comparison
Slovenes
Immigrants from Morocco
5.0%
MALE UNEMPLOYMENT
98.8/ 100
METRIC RATING
51st/ 347
METRIC RANK
5.3%
MALE UNEMPLOYMENT
60.2/ 100
METRIC RATING
166th/ 347
METRIC RANK
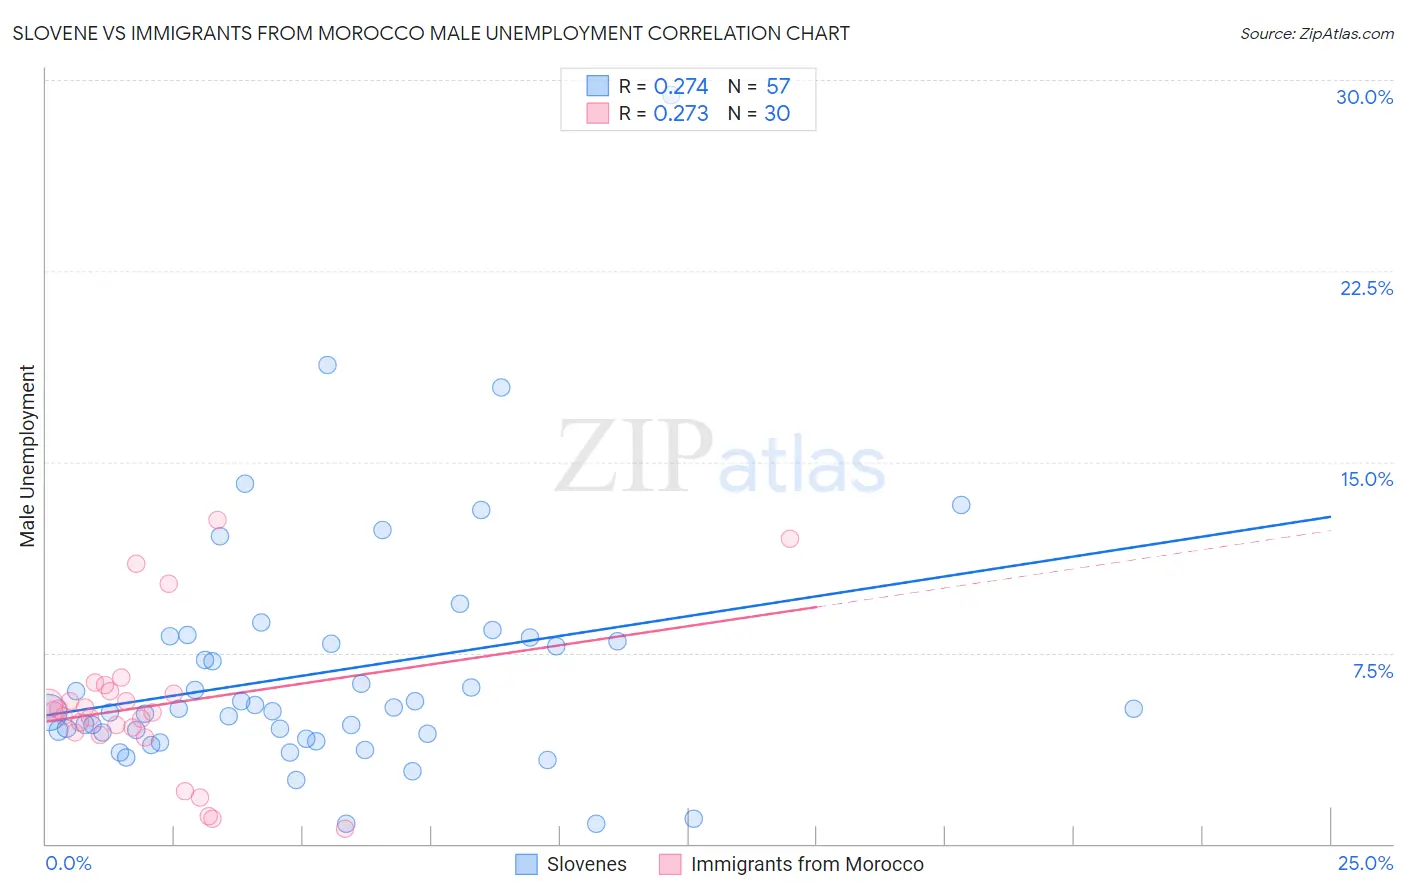
Slovene vs Immigrants from Morocco Male Unemployment Correlation Chart
The statistical analysis conducted on geographies consisting of 260,529,032 people shows a weak positive correlation between the proportion of Slovenes and unemployment rate among males in the United States with a correlation coefficient (R) of 0.274 and weighted average of 5.0%. Similarly, the statistical analysis conducted on geographies consisting of 178,783,560 people shows a weak positive correlation between the proportion of Immigrants from Morocco and unemployment rate among males in the United States with a correlation coefficient (R) of 0.273 and weighted average of 5.3%, a difference of 6.3%.
Male Unemployment Correlation Summary
| Measurement | Slovene | Immigrants from Morocco |
| Minimum | 0.80% | 0.60% |
| Maximum | 29.4% | 12.7% |
| Range | 28.6% | 12.1% |
| Mean | 6.8% | 5.4% |
| Median | 5.3% | 5.2% |
| Interquartile 25% (IQ1) | 4.2% | 4.4% |
| Interquartile 75% (IQ3) | 8.0% | 6.0% |
| Interquartile Range (IQR) | 3.8% | 1.6% |
| Standard Deviation (Sample) | 4.8% | 2.9% |
| Standard Deviation (Population) | 4.8% | 2.9% |
Similar Demographics by Male Unemployment
Demographics Similar to Slovenes by Male Unemployment
In terms of male unemployment, the demographic groups most similar to Slovenes are Irish (5.0%, a difference of 0.020%), Polish (4.9%, a difference of 0.040%), Croatian (4.9%, a difference of 0.040%), Immigrants from Scotland (4.9%, a difference of 0.060%), and Austrian (4.9%, a difference of 0.070%).
| Demographics | Rating | Rank | Male Unemployment |
| Immigrants | Korea | 99.1 /100 | #44 | Exceptional 4.9% |
| Immigrants | Zimbabwe | 99.0 /100 | #45 | Exceptional 4.9% |
| Bhutanese | 98.9 /100 | #46 | Exceptional 4.9% |
| Austrians | 98.9 /100 | #47 | Exceptional 4.9% |
| Immigrants | Scotland | 98.9 /100 | #48 | Exceptional 4.9% |
| Poles | 98.9 /100 | #49 | Exceptional 4.9% |
| Croatians | 98.9 /100 | #50 | Exceptional 4.9% |
| Slovenes | 98.8 /100 | #51 | Exceptional 5.0% |
| Irish | 98.8 /100 | #52 | Exceptional 5.0% |
| Jordanians | 98.8 /100 | #53 | Exceptional 5.0% |
| Yugoslavians | 98.7 /100 | #54 | Exceptional 5.0% |
| Czechoslovakians | 98.7 /100 | #55 | Exceptional 5.0% |
| Immigrants | Bulgaria | 98.7 /100 | #56 | Exceptional 5.0% |
| Turks | 98.5 /100 | #57 | Exceptional 5.0% |
| Lithuanians | 98.5 /100 | #58 | Exceptional 5.0% |
Demographics Similar to Immigrants from Morocco by Male Unemployment
In terms of male unemployment, the demographic groups most similar to Immigrants from Morocco are South American (5.3%, a difference of 0.030%), Afghan (5.3%, a difference of 0.11%), Immigrants from Vietnam (5.3%, a difference of 0.12%), Immigrants from Ireland (5.3%, a difference of 0.15%), and Immigrants from Congo (5.3%, a difference of 0.17%).
| Demographics | Rating | Rank | Male Unemployment |
| Indonesians | 71.2 /100 | #159 | Good 5.2% |
| Immigrants | Norway | 71.0 /100 | #160 | Good 5.2% |
| Immigrants | China | 70.6 /100 | #161 | Good 5.2% |
| Immigrants | Egypt | 65.9 /100 | #162 | Good 5.2% |
| Immigrants | Hong Kong | 65.7 /100 | #163 | Good 5.2% |
| Afghans | 62.0 /100 | #164 | Good 5.3% |
| South Americans | 60.6 /100 | #165 | Good 5.3% |
| Immigrants | Morocco | 60.2 /100 | #166 | Good 5.3% |
| Immigrants | Vietnam | 58.1 /100 | #167 | Average 5.3% |
| Immigrants | Ireland | 57.7 /100 | #168 | Average 5.3% |
| Immigrants | Congo | 57.4 /100 | #169 | Average 5.3% |
| Immigrants | Eastern Europe | 54.1 /100 | #170 | Average 5.3% |
| Peruvians | 51.9 /100 | #171 | Average 5.3% |
| Immigrants | Kazakhstan | 50.8 /100 | #172 | Average 5.3% |
| Immigrants | Russia | 50.7 /100 | #173 | Average 5.3% |