Alaska Native vs Immigrants from Spain Unemployment Among Youth under 25 years
COMPARE
Alaska Native
Immigrants from Spain
Unemployment Among Youth under 25 years
Unemployment Among Youth under 25 years Comparison
Alaska Natives
Immigrants from Spain
14.9%
UNEMPLOYMENT AMONG YOUTH UNDER 25 YEARS
0.0/ 100
METRIC RATING
325th/ 347
METRIC RANK
11.4%
UNEMPLOYMENT AMONG YOUTH UNDER 25 YEARS
84.6/ 100
METRIC RATING
131st/ 347
METRIC RANK
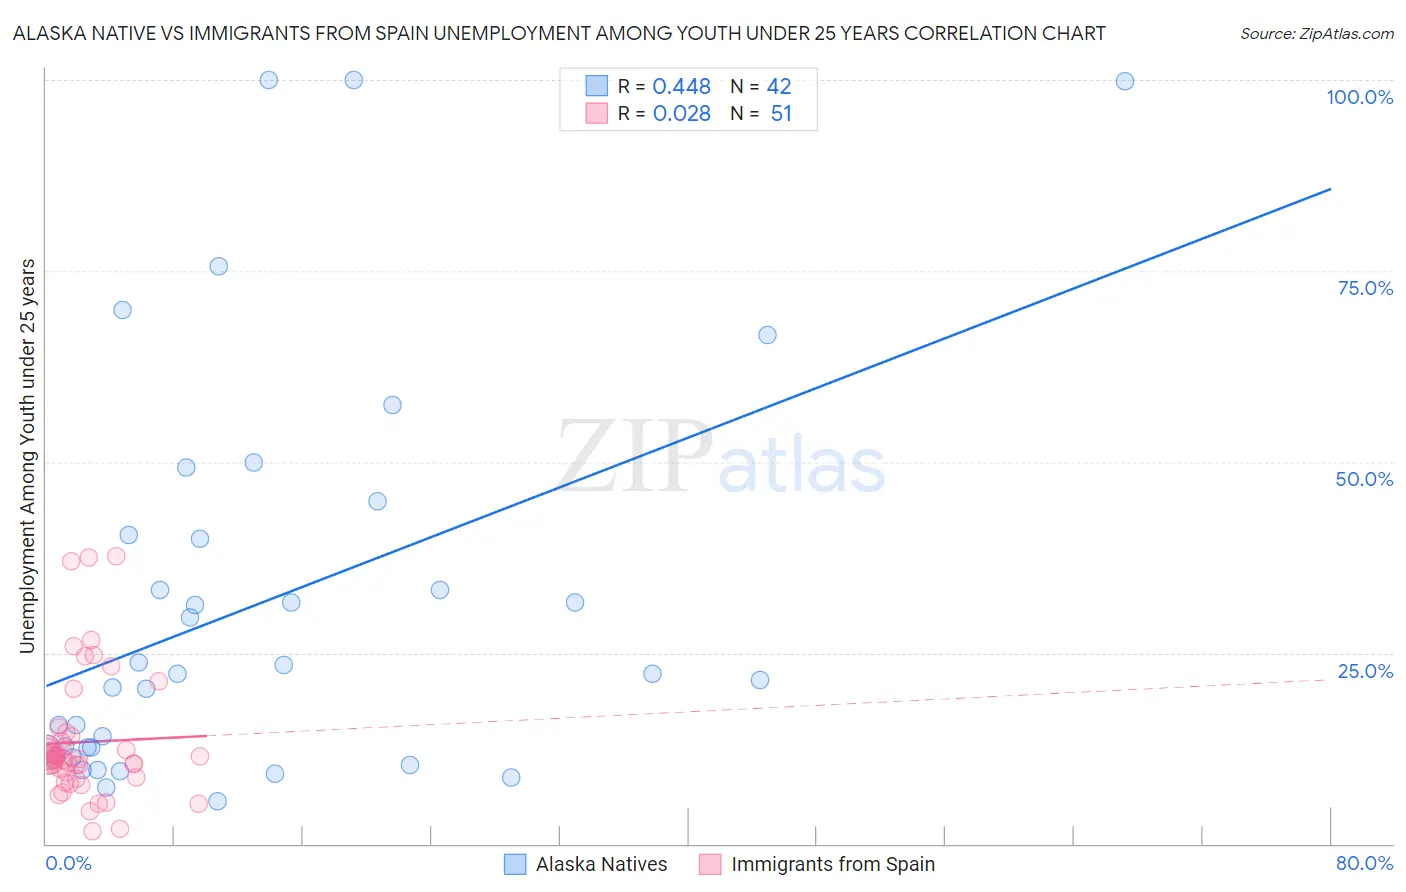
Alaska Native vs Immigrants from Spain Unemployment Among Youth under 25 years Correlation Chart
The statistical analysis conducted on geographies consisting of 76,575,345 people shows a moderate positive correlation between the proportion of Alaska Natives and unemployment rate among youth under the age of 25 in the United States with a correlation coefficient (R) of 0.448 and weighted average of 14.9%. Similarly, the statistical analysis conducted on geographies consisting of 238,223,955 people shows no correlation between the proportion of Immigrants from Spain and unemployment rate among youth under the age of 25 in the United States with a correlation coefficient (R) of 0.028 and weighted average of 11.4%, a difference of 30.7%.
Unemployment Among Youth under 25 years Correlation Summary
| Measurement | Alaska Native | Immigrants from Spain |
| Minimum | 5.6% | 1.7% |
| Maximum | 100.0% | 37.6% |
| Range | 94.4% | 35.9% |
| Mean | 31.6% | 13.3% |
| Median | 22.2% | 11.2% |
| Interquartile 25% (IQ1) | 12.5% | 8.6% |
| Interquartile 75% (IQ3) | 40.4% | 14.0% |
| Interquartile Range (IQR) | 28.0% | 5.4% |
| Standard Deviation (Sample) | 26.3% | 8.3% |
| Standard Deviation (Population) | 25.9% | 8.2% |
Similar Demographics by Unemployment Among Youth under 25 years
Demographics Similar to Alaska Natives by Unemployment Among Youth under 25 years
In terms of unemployment among youth under 25 years, the demographic groups most similar to Alaska Natives are Immigrants from Jamaica (14.8%, a difference of 0.67%), Immigrants from Trinidad and Tobago (14.6%, a difference of 1.8%), Trinidadian and Tobagonian (14.6%, a difference of 1.9%), Cheyenne (14.6%, a difference of 2.0%), and Barbadian (14.6%, a difference of 2.2%).
| Demographics | Rating | Rank | Unemployment Among Youth under 25 years |
| Immigrants | Dominica | 0.0 /100 | #318 | Tragic 14.6% |
| West Indians | 0.0 /100 | #319 | Tragic 14.6% |
| Barbadians | 0.0 /100 | #320 | Tragic 14.6% |
| Cheyenne | 0.0 /100 | #321 | Tragic 14.6% |
| Trinidadians and Tobagonians | 0.0 /100 | #322 | Tragic 14.6% |
| Immigrants | Trinidad and Tobago | 0.0 /100 | #323 | Tragic 14.6% |
| Immigrants | Jamaica | 0.0 /100 | #324 | Tragic 14.8% |
| Alaska Natives | 0.0 /100 | #325 | Tragic 14.9% |
| Immigrants | Barbados | 0.0 /100 | #326 | Tragic 15.2% |
| British West Indians | 0.0 /100 | #327 | Tragic 15.5% |
| Immigrants | Dominican Republic | 0.0 /100 | #328 | Tragic 15.6% |
| Immigrants | Yemen | 0.0 /100 | #329 | Tragic 15.6% |
| Yakama | 0.0 /100 | #330 | Tragic 15.6% |
| Dominicans | 0.0 /100 | #331 | Tragic 15.7% |
| Immigrants | Grenada | 0.0 /100 | #332 | Tragic 15.8% |
Demographics Similar to Immigrants from Spain by Unemployment Among Youth under 25 years
In terms of unemployment among youth under 25 years, the demographic groups most similar to Immigrants from Spain are Hungarian (11.4%, a difference of 0.090%), Turkish (11.4%, a difference of 0.10%), Ethiopian (11.4%, a difference of 0.11%), Immigrants from Hungary (11.4%, a difference of 0.12%), and Lebanese (11.4%, a difference of 0.12%).
| Demographics | Rating | Rank | Unemployment Among Youth under 25 years |
| Italians | 87.2 /100 | #124 | Excellent 11.4% |
| Immigrants | Argentina | 87.2 /100 | #125 | Excellent 11.4% |
| Canadians | 86.6 /100 | #126 | Excellent 11.4% |
| Greeks | 86.2 /100 | #127 | Excellent 11.4% |
| Immigrants | Hungary | 86.0 /100 | #128 | Excellent 11.4% |
| Turks | 85.8 /100 | #129 | Excellent 11.4% |
| Hungarians | 85.7 /100 | #130 | Excellent 11.4% |
| Immigrants | Spain | 84.6 /100 | #131 | Excellent 11.4% |
| Ethiopians | 83.2 /100 | #132 | Excellent 11.4% |
| Lebanese | 83.1 /100 | #133 | Excellent 11.4% |
| Immigrants | Chile | 80.4 /100 | #134 | Excellent 11.4% |
| Immigrants | Oceania | 80.2 /100 | #135 | Excellent 11.4% |
| Romanians | 80.1 /100 | #136 | Excellent 11.4% |
| Asians | 79.7 /100 | #137 | Good 11.4% |
| Immigrants | England | 78.1 /100 | #138 | Good 11.5% |