Korean vs Asian Unemployment Among Ages 65 to 74 years
COMPARE
Korean
Asian
Unemployment Among Ages 65 to 74 years
Unemployment Among Ages 65 to 74 years Comparison
Koreans
Asians
5.3%
UNEMPLOYMENT AMONG AGES 65 TO 74 YEARS
82.6/ 100
METRIC RATING
132nd/ 347
METRIC RANK
5.3%
UNEMPLOYMENT AMONG AGES 65 TO 74 YEARS
91.1/ 100
METRIC RATING
114th/ 347
METRIC RANK
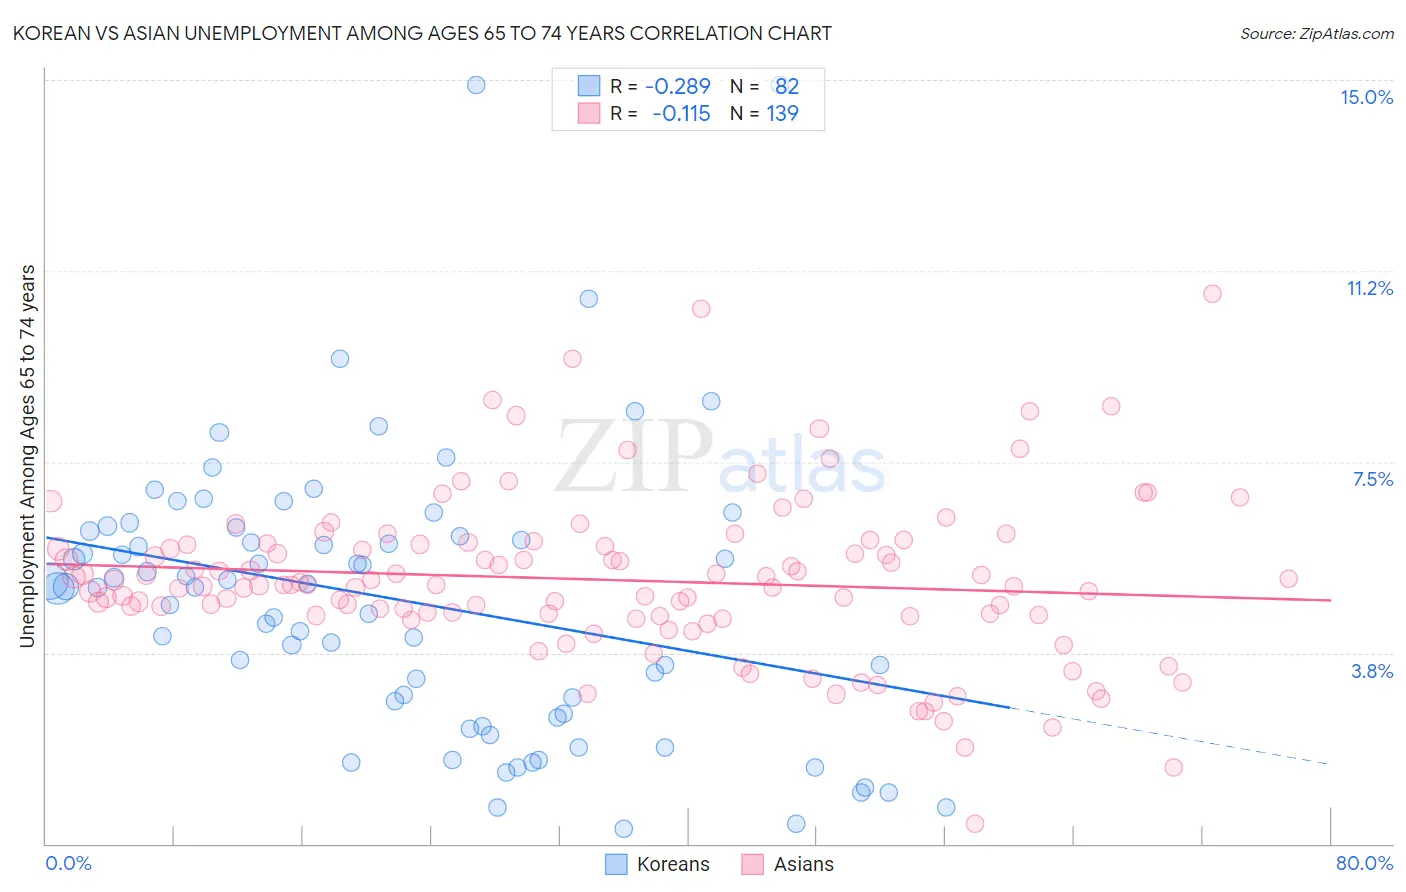
Korean vs Asian Unemployment Among Ages 65 to 74 years Correlation Chart
The statistical analysis conducted on geographies consisting of 424,137,918 people shows a weak negative correlation between the proportion of Koreans and unemployment rate among population between the ages 65 and 74 in the United States with a correlation coefficient (R) of -0.289 and weighted average of 5.3%. Similarly, the statistical analysis conducted on geographies consisting of 441,679,569 people shows a poor negative correlation between the proportion of Asians and unemployment rate among population between the ages 65 and 74 in the United States with a correlation coefficient (R) of -0.115 and weighted average of 5.3%, a difference of 0.65%.
Unemployment Among Ages 65 to 74 years Correlation Summary
| Measurement | Korean | Asian |
| Minimum | 0.30% | 0.40% |
| Maximum | 14.9% | 10.8% |
| Range | 14.6% | 10.4% |
| Mean | 4.8% | 5.2% |
| Median | 5.0% | 5.1% |
| Interquartile 25% (IQ1) | 2.6% | 4.5% |
| Interquartile 75% (IQ3) | 6.1% | 5.9% |
| Interquartile Range (IQR) | 3.6% | 1.4% |
| Standard Deviation (Sample) | 2.8% | 1.6% |
| Standard Deviation (Population) | 2.8% | 1.6% |
Demographics Similar to Koreans and Asians by Unemployment Among Ages 65 to 74 years
In terms of unemployment among ages 65 to 74 years, the demographic groups most similar to Koreans are Immigrants from Russia (5.3%, a difference of 0.020%), Ukrainian (5.3%, a difference of 0.030%), Eastern European (5.3%, a difference of 0.19%), Immigrants from England (5.3%, a difference of 0.23%), and Immigrants from Hong Kong (5.3%, a difference of 0.26%). Similarly, the demographic groups most similar to Asians are Immigrants from Turkey (5.3%, a difference of 0.020%), Immigrants from Germany (5.3%, a difference of 0.050%), Australian (5.3%, a difference of 0.060%), Immigrants from Korea (5.3%, a difference of 0.090%), and Immigrants from Belarus (5.3%, a difference of 0.10%).
| Demographics | Rating | Rank | Unemployment Among Ages 65 to 74 years |
| Immigrants | Germany | 91.6 /100 | #113 | Exceptional 5.3% |
| Asians | 91.1 /100 | #114 | Exceptional 5.3% |
| Immigrants | Turkey | 90.8 /100 | #115 | Exceptional 5.3% |
| Australians | 90.4 /100 | #116 | Exceptional 5.3% |
| Immigrants | Korea | 90.2 /100 | #117 | Exceptional 5.3% |
| Immigrants | Belarus | 90.1 /100 | #118 | Exceptional 5.3% |
| Immigrants | Fiji | 89.9 /100 | #119 | Excellent 5.3% |
| Immigrants | Switzerland | 89.9 /100 | #120 | Excellent 5.3% |
| Immigrants | Australia | 89.1 /100 | #121 | Excellent 5.3% |
| Immigrants | Canada | 89.0 /100 | #122 | Excellent 5.3% |
| Czechoslovakians | 88.6 /100 | #123 | Excellent 5.3% |
| Immigrants | Ukraine | 87.5 /100 | #124 | Excellent 5.3% |
| Pakistanis | 87.5 /100 | #125 | Excellent 5.3% |
| Immigrants | South Eastern Asia | 87.2 /100 | #126 | Excellent 5.3% |
| Immigrants | North America | 86.7 /100 | #127 | Excellent 5.3% |
| Immigrants | Hong Kong | 86.5 /100 | #128 | Excellent 5.3% |
| Immigrants | England | 86.2 /100 | #129 | Excellent 5.3% |
| Eastern Europeans | 85.6 /100 | #130 | Excellent 5.3% |
| Immigrants | Russia | 83.0 /100 | #131 | Excellent 5.3% |
| Koreans | 82.6 /100 | #132 | Excellent 5.3% |
| Ukrainians | 82.0 /100 | #133 | Excellent 5.3% |