Cajun vs Asian Unemployment Among Ages 65 to 74 years
COMPARE
Cajun
Asian
Unemployment Among Ages 65 to 74 years
Unemployment Among Ages 65 to 74 years Comparison
Cajuns
Asians
5.5%
UNEMPLOYMENT AMONG AGES 65 TO 74 YEARS
1.8/ 100
METRIC RATING
238th/ 347
METRIC RANK
5.3%
UNEMPLOYMENT AMONG AGES 65 TO 74 YEARS
91.1/ 100
METRIC RATING
114th/ 347
METRIC RANK
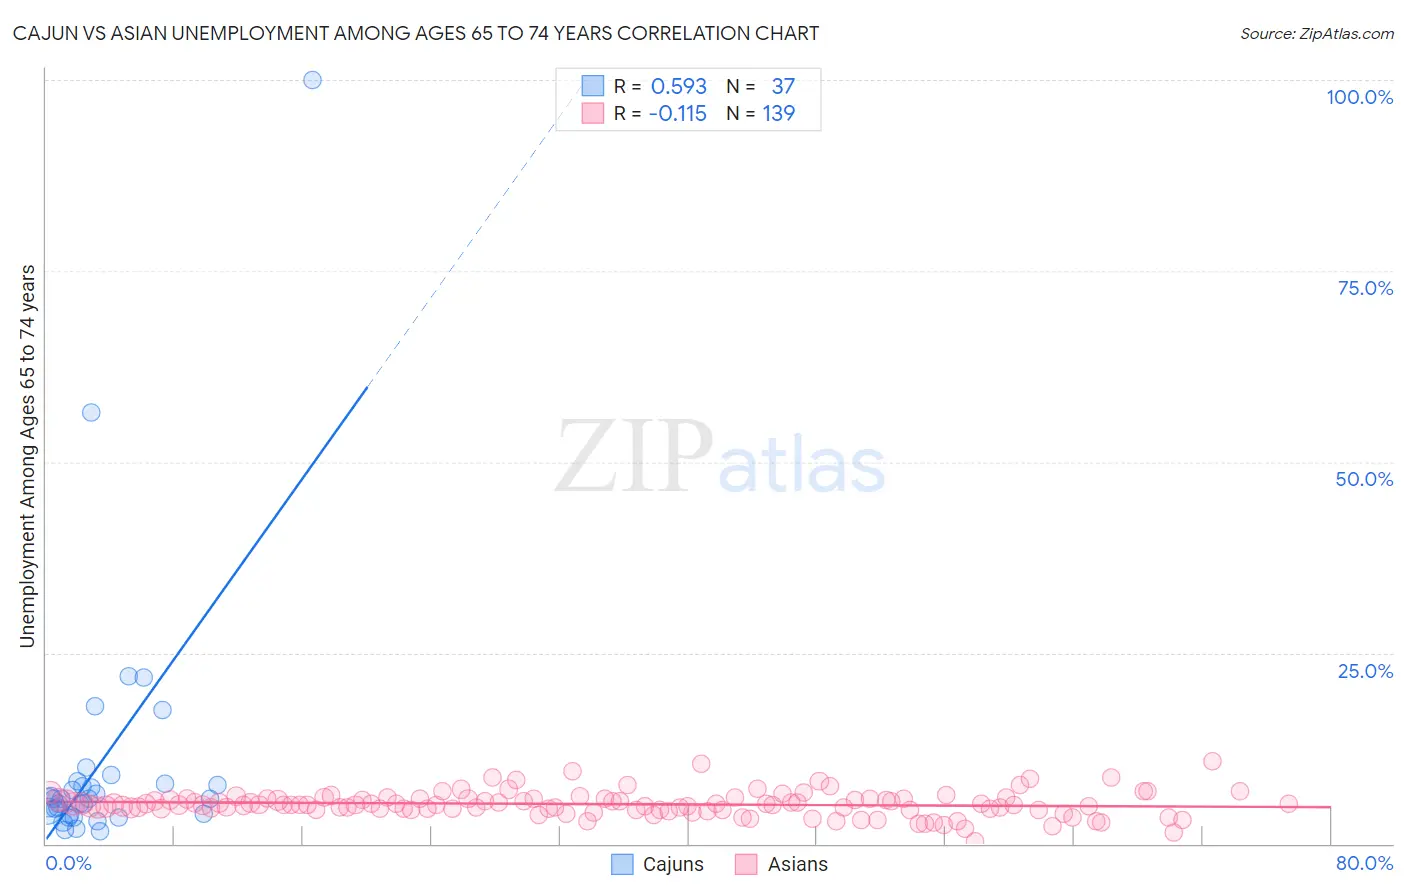
Cajun vs Asian Unemployment Among Ages 65 to 74 years Correlation Chart
The statistical analysis conducted on geographies consisting of 137,241,864 people shows a substantial positive correlation between the proportion of Cajuns and unemployment rate among population between the ages 65 and 74 in the United States with a correlation coefficient (R) of 0.593 and weighted average of 5.5%. Similarly, the statistical analysis conducted on geographies consisting of 441,679,569 people shows a poor negative correlation between the proportion of Asians and unemployment rate among population between the ages 65 and 74 in the United States with a correlation coefficient (R) of -0.115 and weighted average of 5.3%, a difference of 5.4%.
Unemployment Among Ages 65 to 74 years Correlation Summary
| Measurement | Cajun | Asian |
| Minimum | 1.7% | 0.40% |
| Maximum | 100.0% | 10.8% |
| Range | 98.3% | 10.4% |
| Mean | 10.8% | 5.2% |
| Median | 5.9% | 5.1% |
| Interquartile 25% (IQ1) | 3.9% | 4.5% |
| Interquartile 75% (IQ3) | 8.0% | 5.9% |
| Interquartile Range (IQR) | 4.1% | 1.4% |
| Standard Deviation (Sample) | 17.8% | 1.6% |
| Standard Deviation (Population) | 17.6% | 1.6% |
Similar Demographics by Unemployment Among Ages 65 to 74 years
Demographics Similar to Cajuns by Unemployment Among Ages 65 to 74 years
In terms of unemployment among ages 65 to 74 years, the demographic groups most similar to Cajuns are German Russian (5.5%, a difference of 0.080%), Hopi (5.5%, a difference of 0.16%), Immigrants from Belize (5.5%, a difference of 0.16%), French American Indian (5.5%, a difference of 0.17%), and Peruvian (5.5%, a difference of 0.17%).
| Demographics | Rating | Rank | Unemployment Among Ages 65 to 74 years |
| Israelis | 2.5 /100 | #231 | Tragic 5.5% |
| Nigerians | 2.5 /100 | #232 | Tragic 5.5% |
| South American Indians | 2.3 /100 | #233 | Tragic 5.5% |
| French American Indians | 2.2 /100 | #234 | Tragic 5.5% |
| Peruvians | 2.2 /100 | #235 | Tragic 5.5% |
| Hopi | 2.2 /100 | #236 | Tragic 5.5% |
| Immigrants | Belize | 2.2 /100 | #237 | Tragic 5.5% |
| Cajuns | 1.8 /100 | #238 | Tragic 5.5% |
| German Russians | 1.6 /100 | #239 | Tragic 5.5% |
| Ghanaians | 1.4 /100 | #240 | Tragic 5.6% |
| Cree | 1.4 /100 | #241 | Tragic 5.6% |
| Immigrants | Ghana | 1.4 /100 | #242 | Tragic 5.6% |
| Immigrants | Peru | 1.3 /100 | #243 | Tragic 5.6% |
| Immigrants | Micronesia | 0.9 /100 | #244 | Tragic 5.6% |
| Immigrants | Greece | 0.9 /100 | #245 | Tragic 5.6% |
Demographics Similar to Asians by Unemployment Among Ages 65 to 74 years
In terms of unemployment among ages 65 to 74 years, the demographic groups most similar to Asians are Immigrants from Turkey (5.3%, a difference of 0.020%), Immigrants from Germany (5.3%, a difference of 0.050%), Australian (5.3%, a difference of 0.060%), Immigrants from Korea (5.3%, a difference of 0.090%), and Immigrants from Belarus (5.3%, a difference of 0.10%).
| Demographics | Rating | Rank | Unemployment Among Ages 65 to 74 years |
| Austrians | 94.5 /100 | #107 | Exceptional 5.2% |
| Immigrants | Malaysia | 94.1 /100 | #108 | Exceptional 5.2% |
| Immigrants | Singapore | 93.9 /100 | #109 | Exceptional 5.2% |
| Immigrants | Bolivia | 93.6 /100 | #110 | Exceptional 5.2% |
| Sri Lankans | 92.7 /100 | #111 | Exceptional 5.3% |
| Immigrants | South Central Asia | 92.4 /100 | #112 | Exceptional 5.3% |
| Immigrants | Germany | 91.6 /100 | #113 | Exceptional 5.3% |
| Asians | 91.1 /100 | #114 | Exceptional 5.3% |
| Immigrants | Turkey | 90.8 /100 | #115 | Exceptional 5.3% |
| Australians | 90.4 /100 | #116 | Exceptional 5.3% |
| Immigrants | Korea | 90.2 /100 | #117 | Exceptional 5.3% |
| Immigrants | Belarus | 90.1 /100 | #118 | Exceptional 5.3% |
| Immigrants | Fiji | 89.9 /100 | #119 | Excellent 5.3% |
| Immigrants | Switzerland | 89.9 /100 | #120 | Excellent 5.3% |
| Immigrants | Australia | 89.1 /100 | #121 | Excellent 5.3% |