Alaska Native vs Cheyenne Unemployment Among Ages 65 to 74 years
COMPARE
Alaska Native
Cheyenne
Unemployment Among Ages 65 to 74 years
Unemployment Among Ages 65 to 74 years Comparison
Alaska Natives
Cheyenne
6.8%
UNEMPLOYMENT AMONG AGES 65 TO 74 YEARS
0.0/ 100
METRIC RATING
341st/ 347
METRIC RANK
5.8%
UNEMPLOYMENT AMONG AGES 65 TO 74 YEARS
0.0/ 100
METRIC RATING
306th/ 347
METRIC RANK
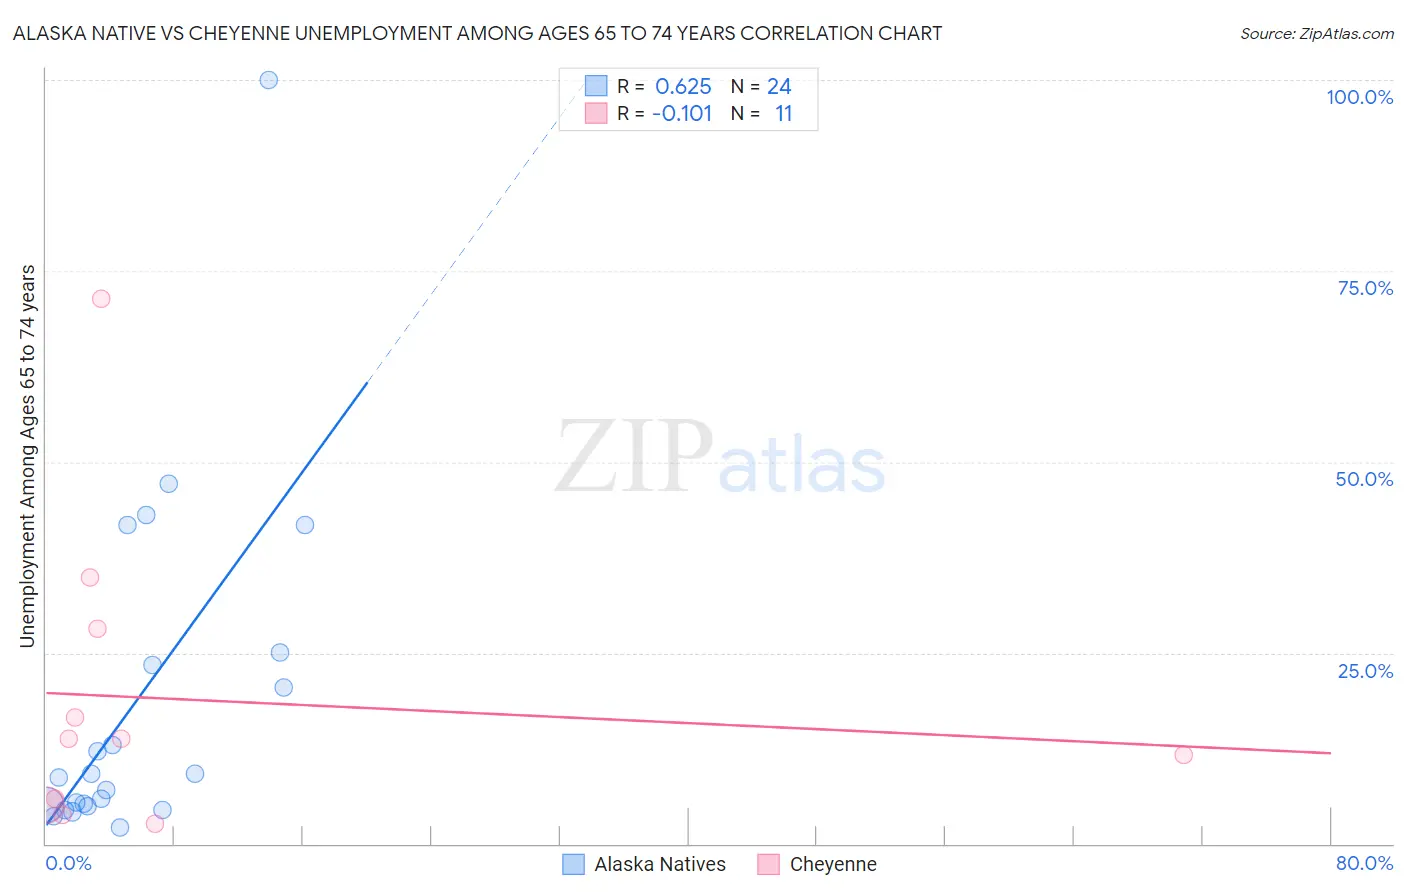
Alaska Native vs Cheyenne Unemployment Among Ages 65 to 74 years Correlation Chart
The statistical analysis conducted on geographies consisting of 72,668,182 people shows a significant positive correlation between the proportion of Alaska Natives and unemployment rate among population between the ages 65 and 74 in the United States with a correlation coefficient (R) of 0.625 and weighted average of 6.8%. Similarly, the statistical analysis conducted on geographies consisting of 75,945,268 people shows a poor negative correlation between the proportion of Cheyenne and unemployment rate among population between the ages 65 and 74 in the United States with a correlation coefficient (R) of -0.101 and weighted average of 5.8%, a difference of 17.0%.
Unemployment Among Ages 65 to 74 years Correlation Summary
| Measurement | Alaska Native | Cheyenne |
| Minimum | 2.2% | 2.6% |
| Maximum | 100.0% | 71.4% |
| Range | 97.8% | 68.8% |
| Mean | 18.6% | 18.9% |
| Median | 8.9% | 13.7% |
| Interquartile 25% (IQ1) | 5.0% | 5.1% |
| Interquartile 75% (IQ3) | 24.2% | 28.2% |
| Interquartile Range (IQR) | 19.2% | 23.1% |
| Standard Deviation (Sample) | 22.5% | 20.1% |
| Standard Deviation (Population) | 22.0% | 19.2% |
Similar Demographics by Unemployment Among Ages 65 to 74 years
Demographics Similar to Alaska Natives by Unemployment Among Ages 65 to 74 years
In terms of unemployment among ages 65 to 74 years, the demographic groups most similar to Alaska Natives are Navajo (6.9%, a difference of 1.5%), Pima (6.6%, a difference of 3.2%), Yakama (6.6%, a difference of 4.1%), Tlingit-Haida (6.5%, a difference of 4.5%), and Ute (6.5%, a difference of 4.6%).
| Demographics | Rating | Rank | Unemployment Among Ages 65 to 74 years |
| Paiute | 0.0 /100 | #333 | Tragic 6.3% |
| Taiwanese | 0.0 /100 | #334 | Tragic 6.3% |
| Puerto Ricans | 0.0 /100 | #335 | Tragic 6.4% |
| Immigrants | Armenia | 0.0 /100 | #336 | Tragic 6.5% |
| Ute | 0.0 /100 | #337 | Tragic 6.5% |
| Tlingit-Haida | 0.0 /100 | #338 | Tragic 6.5% |
| Yakama | 0.0 /100 | #339 | Tragic 6.6% |
| Pima | 0.0 /100 | #340 | Tragic 6.6% |
| Alaska Natives | 0.0 /100 | #341 | Tragic 6.8% |
| Navajo | 0.0 /100 | #342 | Tragic 6.9% |
| Alaskan Athabascans | 0.0 /100 | #343 | Tragic 7.4% |
| Inupiat | 0.0 /100 | #344 | Tragic 7.5% |
| Immigrants | Yemen | 0.0 /100 | #345 | Tragic 8.3% |
| Yup'ik | 0.0 /100 | #346 | Tragic 9.5% |
| Crow | 0.0 /100 | #347 | Tragic 17.4% |
Demographics Similar to Cheyenne by Unemployment Among Ages 65 to 74 years
In terms of unemployment among ages 65 to 74 years, the demographic groups most similar to Cheyenne are Mexican (5.8%, a difference of 0.0%), British West Indian (5.8%, a difference of 0.0%), Salvadoran (5.8%, a difference of 0.010%), Arapaho (5.8%, a difference of 0.020%), and Liberian (5.8%, a difference of 0.040%).
| Demographics | Rating | Rank | Unemployment Among Ages 65 to 74 years |
| Barbadians | 0.0 /100 | #299 | Tragic 5.8% |
| Ecuadorians | 0.0 /100 | #300 | Tragic 5.8% |
| Armenians | 0.0 /100 | #301 | Tragic 5.8% |
| Liberians | 0.0 /100 | #302 | Tragic 5.8% |
| Arapaho | 0.0 /100 | #303 | Tragic 5.8% |
| Salvadorans | 0.0 /100 | #304 | Tragic 5.8% |
| Mexicans | 0.0 /100 | #305 | Tragic 5.8% |
| Cheyenne | 0.0 /100 | #306 | Tragic 5.8% |
| British West Indians | 0.0 /100 | #307 | Tragic 5.8% |
| Guatemalans | 0.0 /100 | #308 | Tragic 5.8% |
| Immigrants | Ecuador | 0.0 /100 | #309 | Tragic 5.8% |
| Immigrants | Bangladesh | 0.0 /100 | #310 | Tragic 5.9% |
| Venezuelans | 0.0 /100 | #311 | Tragic 5.9% |
| Hispanics or Latinos | 0.0 /100 | #312 | Tragic 5.9% |
| Vietnamese | 0.0 /100 | #313 | Tragic 5.9% |