Canadian vs Immigrants from Norway Child Poverty Under the Age of 5
COMPARE
Canadian
Immigrants from Norway
Child Poverty Under the Age of 5
Child Poverty Under the Age of 5 Comparison
Canadians
Immigrants from Norway
16.7%
CHILD POVERTY UNDER THE AGE OF 5
77.6/ 100
METRIC RATING
151st/ 347
METRIC RANK
16.3%
CHILD POVERTY UNDER THE AGE OF 5
89.3/ 100
METRIC RATING
130th/ 347
METRIC RANK
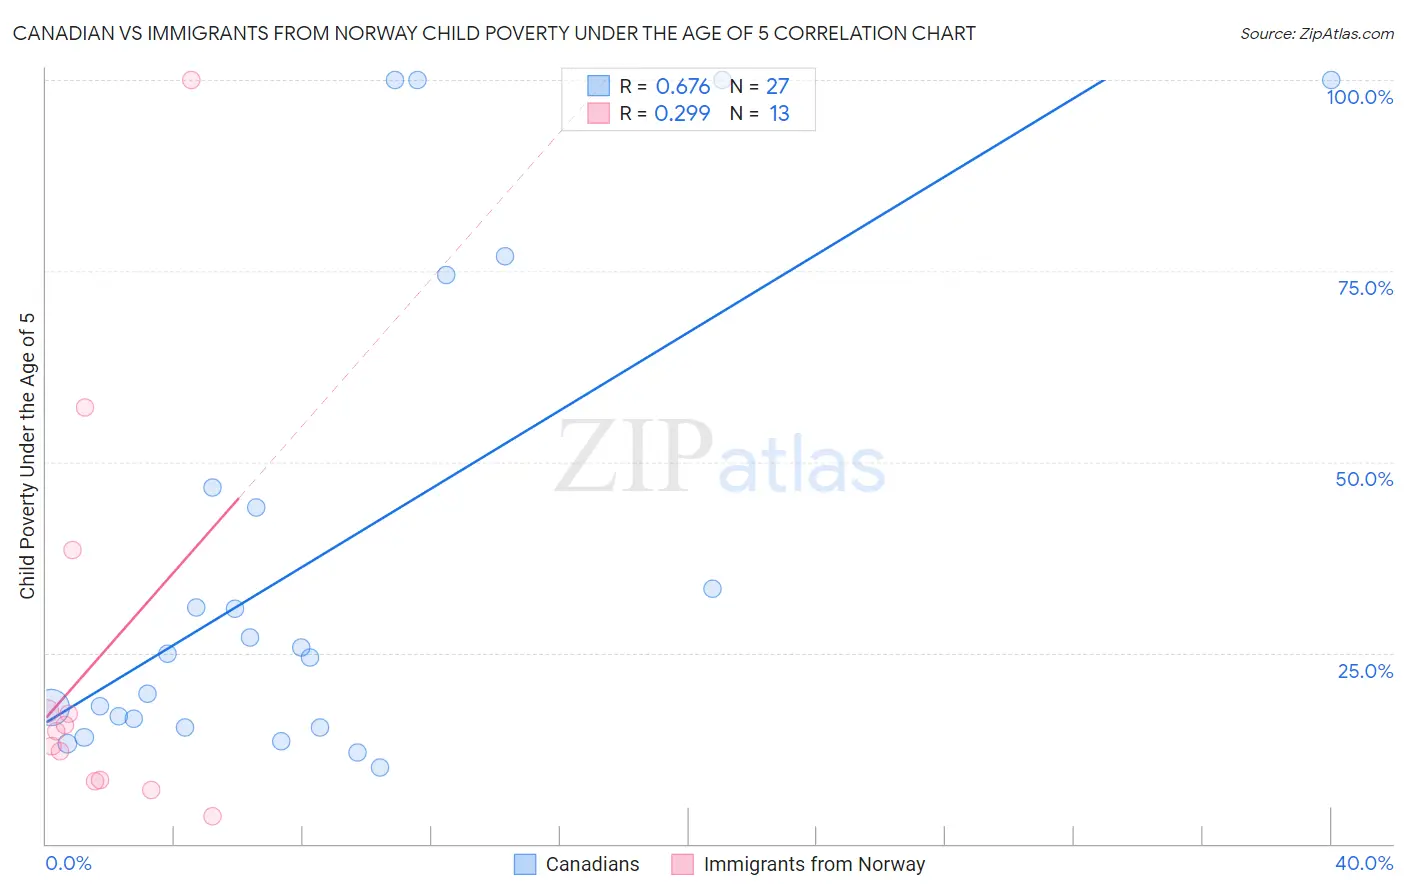
Canadian vs Immigrants from Norway Child Poverty Under the Age of 5 Correlation Chart
The statistical analysis conducted on geographies consisting of 415,262,457 people shows a significant positive correlation between the proportion of Canadians and poverty level among children under the age of 5 in the United States with a correlation coefficient (R) of 0.676 and weighted average of 16.7%. Similarly, the statistical analysis conducted on geographies consisting of 114,119,932 people shows a weak positive correlation between the proportion of Immigrants from Norway and poverty level among children under the age of 5 in the United States with a correlation coefficient (R) of 0.299 and weighted average of 16.3%, a difference of 2.4%.
Child Poverty Under the Age of 5 Correlation Summary
| Measurement | Canadian | Immigrants from Norway |
| Minimum | 10.0% | 3.6% |
| Maximum | 100.0% | 100.0% |
| Range | 90.0% | 96.4% |
| Mean | 37.8% | 24.0% |
| Median | 24.9% | 14.7% |
| Interquartile 25% (IQ1) | 15.3% | 8.3% |
| Interquartile 75% (IQ3) | 46.6% | 27.9% |
| Interquartile Range (IQR) | 31.3% | 19.6% |
| Standard Deviation (Sample) | 31.3% | 27.1% |
| Standard Deviation (Population) | 30.7% | 26.0% |
Similar Demographics by Child Poverty Under the Age of 5
Demographics Similar to Canadians by Child Poverty Under the Age of 5
In terms of child poverty under the age of 5, the demographic groups most similar to Canadians are Colombian (16.7%, a difference of 0.030%), Belgian (16.7%, a difference of 0.060%), Dutch (16.7%, a difference of 0.080%), New Zealander (16.6%, a difference of 0.17%), and Syrian (16.6%, a difference of 0.23%).
| Demographics | Rating | Rank | Child Poverty Under the Age of 5 |
| Ethiopians | 82.7 /100 | #144 | Excellent 16.5% |
| Immigrants | Ethiopia | 82.1 /100 | #145 | Excellent 16.6% |
| Israelis | 82.0 /100 | #146 | Excellent 16.6% |
| Immigrants | Nepal | 80.3 /100 | #147 | Excellent 16.6% |
| Syrians | 79.1 /100 | #148 | Good 16.6% |
| New Zealanders | 78.7 /100 | #149 | Good 16.6% |
| Colombians | 77.8 /100 | #150 | Good 16.7% |
| Canadians | 77.6 /100 | #151 | Good 16.7% |
| Belgians | 77.2 /100 | #152 | Good 16.7% |
| Dutch | 77.1 /100 | #153 | Good 16.7% |
| Immigrants | Venezuela | 76.0 /100 | #154 | Good 16.7% |
| South Americans | 75.1 /100 | #155 | Good 16.7% |
| Afghans | 74.4 /100 | #156 | Good 16.8% |
| Venezuelans | 73.7 /100 | #157 | Good 16.8% |
| Czechoslovakians | 72.5 /100 | #158 | Good 16.8% |
Demographics Similar to Immigrants from Norway by Child Poverty Under the Age of 5
In terms of child poverty under the age of 5, the demographic groups most similar to Immigrants from Norway are British (16.3%, a difference of 0.030%), South African (16.2%, a difference of 0.21%), Finnish (16.3%, a difference of 0.29%), Serbian (16.3%, a difference of 0.32%), and Icelander (16.3%, a difference of 0.39%).
| Demographics | Rating | Rank | Child Poverty Under the Age of 5 |
| Austrians | 92.0 /100 | #123 | Exceptional 16.1% |
| Swiss | 92.0 /100 | #124 | Exceptional 16.1% |
| Native Hawaiians | 91.8 /100 | #125 | Exceptional 16.2% |
| Immigrants | Albania | 91.8 /100 | #126 | Exceptional 16.2% |
| Immigrants | England | 91.5 /100 | #127 | Exceptional 16.2% |
| South Africans | 90.1 /100 | #128 | Exceptional 16.2% |
| British | 89.4 /100 | #129 | Excellent 16.3% |
| Immigrants | Norway | 89.3 /100 | #130 | Excellent 16.3% |
| Finns | 88.3 /100 | #131 | Excellent 16.3% |
| Serbians | 88.2 /100 | #132 | Excellent 16.3% |
| Icelanders | 87.9 /100 | #133 | Excellent 16.3% |
| Immigrants | North Macedonia | 87.8 /100 | #134 | Excellent 16.4% |
| Brazilians | 87.8 /100 | #135 | Excellent 16.4% |
| Immigrants | Northern Africa | 87.5 /100 | #136 | Excellent 16.4% |
| Immigrants | Chile | 85.3 /100 | #137 | Excellent 16.4% |