Zimbabwean vs Jamaican Female Poverty Among 25-34 Year Olds
COMPARE
Zimbabwean
Jamaican
Female Poverty Among 25-34 Year Olds
Female Poverty Among 25-34 Year Olds Comparison
Zimbabweans
Jamaicans
11.7%
FEMALE POVERTY AMONG 25-34 YEAR OLDS
99.9/ 100
METRIC RATING
34th/ 347
METRIC RANK
14.8%
FEMALE POVERTY AMONG 25-34 YEAR OLDS
1.0/ 100
METRIC RATING
246th/ 347
METRIC RANK
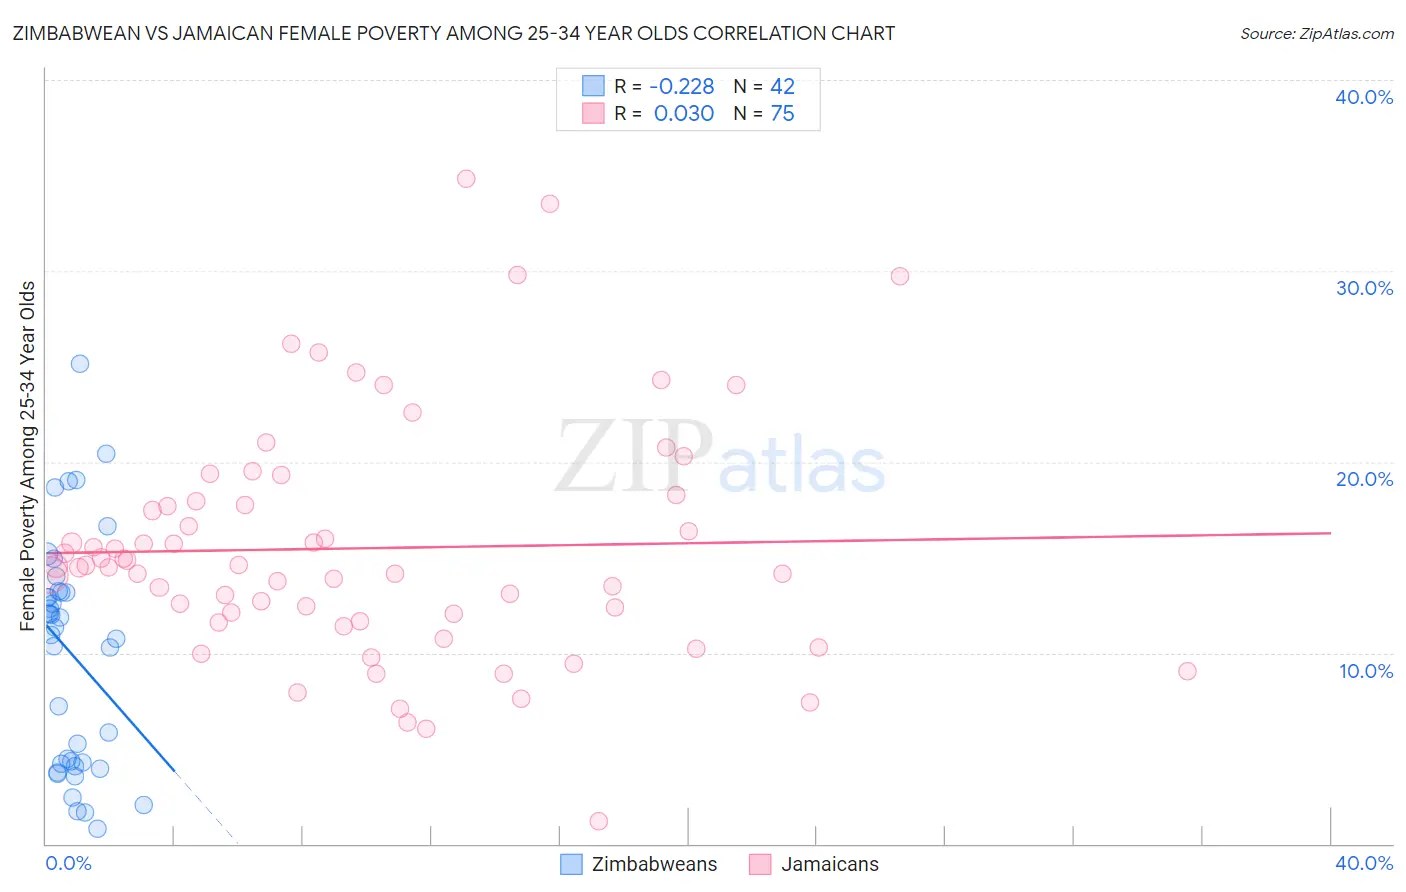
Zimbabwean vs Jamaican Female Poverty Among 25-34 Year Olds Correlation Chart
The statistical analysis conducted on geographies consisting of 69,074,589 people shows a weak negative correlation between the proportion of Zimbabweans and poverty level among females between the ages 25 and 34 in the United States with a correlation coefficient (R) of -0.228 and weighted average of 11.7%. Similarly, the statistical analysis conducted on geographies consisting of 363,151,560 people shows no correlation between the proportion of Jamaicans and poverty level among females between the ages 25 and 34 in the United States with a correlation coefficient (R) of 0.030 and weighted average of 14.8%, a difference of 27.1%.
Female Poverty Among 25-34 Year Olds Correlation Summary
| Measurement | Zimbabwean | Jamaican |
| Minimum | 0.80% | 1.1% |
| Maximum | 25.2% | 34.8% |
| Range | 24.4% | 33.7% |
| Mean | 10.0% | 15.5% |
| Median | 11.2% | 14.5% |
| Interquartile 25% (IQ1) | 4.2% | 11.6% |
| Interquartile 75% (IQ3) | 13.2% | 17.9% |
| Interquartile Range (IQR) | 9.0% | 6.3% |
| Standard Deviation (Sample) | 6.0% | 6.3% |
| Standard Deviation (Population) | 5.9% | 6.2% |
Similar Demographics by Female Poverty Among 25-34 Year Olds
Demographics Similar to Zimbabweans by Female Poverty Among 25-34 Year Olds
In terms of female poverty among 25-34 year olds, the demographic groups most similar to Zimbabweans are Immigrants from Poland (11.6%, a difference of 0.22%), Cambodian (11.7%, a difference of 0.27%), Immigrants from Asia (11.6%, a difference of 0.57%), Immigrants from Sri Lanka (11.8%, a difference of 0.76%), and Immigrants from Japan (11.6%, a difference of 0.87%).
| Demographics | Rating | Rank | Female Poverty Among 25-34 Year Olds |
| Immigrants | Greece | 99.9 /100 | #27 | Exceptional 11.5% |
| Immigrants | Pakistan | 99.9 /100 | #28 | Exceptional 11.5% |
| Bulgarians | 99.9 /100 | #29 | Exceptional 11.5% |
| Cypriots | 99.9 /100 | #30 | Exceptional 11.5% |
| Immigrants | Japan | 99.9 /100 | #31 | Exceptional 11.6% |
| Immigrants | Asia | 99.9 /100 | #32 | Exceptional 11.6% |
| Immigrants | Poland | 99.9 /100 | #33 | Exceptional 11.6% |
| Zimbabweans | 99.9 /100 | #34 | Exceptional 11.7% |
| Cambodians | 99.9 /100 | #35 | Exceptional 11.7% |
| Immigrants | Sri Lanka | 99.8 /100 | #36 | Exceptional 11.8% |
| Taiwanese | 99.8 /100 | #37 | Exceptional 11.8% |
| Immigrants | North Macedonia | 99.8 /100 | #38 | Exceptional 11.8% |
| Latvians | 99.8 /100 | #39 | Exceptional 11.8% |
| Immigrants | Bulgaria | 99.8 /100 | #40 | Exceptional 11.8% |
| Immigrants | Indonesia | 99.8 /100 | #41 | Exceptional 11.8% |
Demographics Similar to Jamaicans by Female Poverty Among 25-34 Year Olds
In terms of female poverty among 25-34 year olds, the demographic groups most similar to Jamaicans are Immigrants from Middle Africa (14.8%, a difference of 0.040%), Immigrants from Nicaragua (14.8%, a difference of 0.22%), Immigrants from Bangladesh (14.8%, a difference of 0.22%), Scotch-Irish (14.8%, a difference of 0.26%), and Barbadian (14.8%, a difference of 0.26%).
| Demographics | Rating | Rank | Female Poverty Among 25-34 Year Olds |
| Malaysians | 1.4 /100 | #239 | Tragic 14.7% |
| Immigrants | Grenada | 1.3 /100 | #240 | Tragic 14.7% |
| Scotch-Irish | 1.2 /100 | #241 | Tragic 14.8% |
| Barbadians | 1.2 /100 | #242 | Tragic 14.8% |
| Immigrants | Nicaragua | 1.1 /100 | #243 | Tragic 14.8% |
| Immigrants | Bangladesh | 1.1 /100 | #244 | Tragic 14.8% |
| Immigrants | Middle Africa | 1.0 /100 | #245 | Tragic 14.8% |
| Jamaicans | 1.0 /100 | #246 | Tragic 14.8% |
| German Russians | 0.8 /100 | #247 | Tragic 14.9% |
| Immigrants | Western Africa | 0.8 /100 | #248 | Tragic 14.9% |
| Immigrants | Haiti | 0.5 /100 | #249 | Tragic 15.0% |
| Immigrants | El Salvador | 0.5 /100 | #250 | Tragic 15.0% |
| Haitians | 0.5 /100 | #251 | Tragic 15.0% |
| Belizeans | 0.4 /100 | #252 | Tragic 15.1% |
| Immigrants | West Indies | 0.4 /100 | #253 | Tragic 15.1% |