Yuman vs Assyrian/Chaldean/Syriac Female Poverty Among 18-24 Year Olds
COMPARE
Yuman
Assyrian/Chaldean/Syriac
Female Poverty Among 18-24 Year Olds
Female Poverty Among 18-24 Year Olds Comparison
Yuman
Assyrians/Chaldeans/Syriacs
24.0%
FEMALE POVERTY AMONG 18-24 YEAR OLDS
0.0/ 100
METRIC RATING
312th/ 347
METRIC RANK
13.7%
FEMALE POVERTY AMONG 18-24 YEAR OLDS
100.0/ 100
METRIC RATING
1st/ 347
METRIC RANK
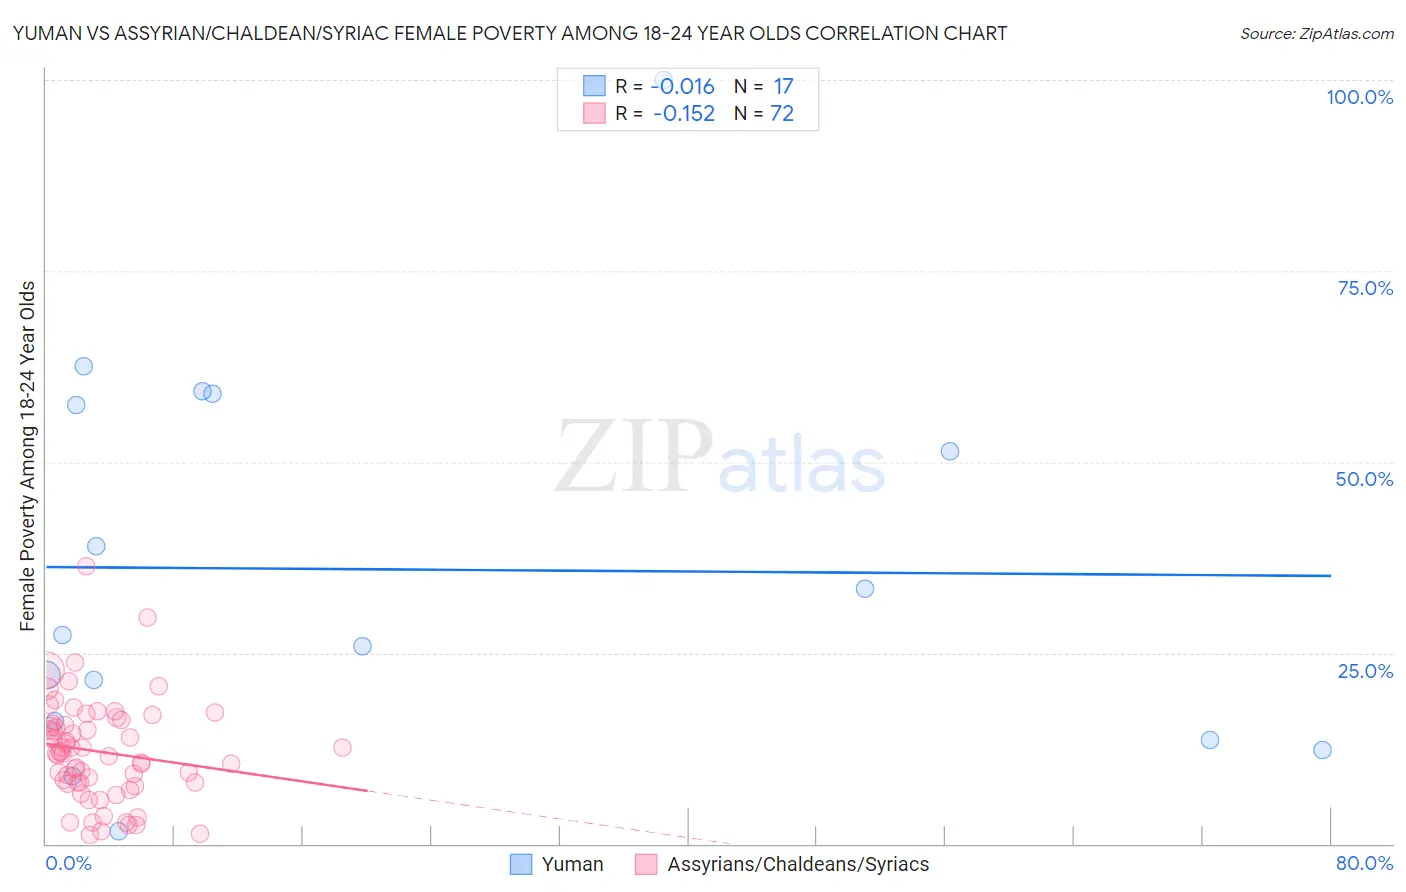
Yuman vs Assyrian/Chaldean/Syriac Female Poverty Among 18-24 Year Olds Correlation Chart
The statistical analysis conducted on geographies consisting of 40,585,448 people shows no correlation between the proportion of Yuman and poverty level among females between the ages 18 and 24 in the United States with a correlation coefficient (R) of -0.016 and weighted average of 24.0%. Similarly, the statistical analysis conducted on geographies consisting of 109,311,768 people shows a poor negative correlation between the proportion of Assyrians/Chaldeans/Syriacs and poverty level among females between the ages 18 and 24 in the United States with a correlation coefficient (R) of -0.152 and weighted average of 13.7%, a difference of 74.8%.
Female Poverty Among 18-24 Year Olds Correlation Summary
| Measurement | Yuman | Assyrian/Chaldean/Syriac |
| Minimum | 1.7% | 1.2% |
| Maximum | 100.0% | 36.4% |
| Range | 98.3% | 35.2% |
| Mean | 35.9% | 12.1% |
| Median | 27.4% | 11.9% |
| Interquartile 25% (IQ1) | 14.9% | 8.0% |
| Interquartile 75% (IQ3) | 58.2% | 15.6% |
| Interquartile Range (IQR) | 43.3% | 7.6% |
| Standard Deviation (Sample) | 25.7% | 6.5% |
| Standard Deviation (Population) | 24.9% | 6.5% |
Similar Demographics by Female Poverty Among 18-24 Year Olds
Demographics Similar to Yuman by Female Poverty Among 18-24 Year Olds
In terms of female poverty among 18-24 year olds, the demographic groups most similar to Yuman are Creek (24.2%, a difference of 1.1%), Potawatomi (23.7%, a difference of 1.2%), Choctaw (24.3%, a difference of 1.2%), Black/African American (24.3%, a difference of 1.4%), and Comanche (23.6%, a difference of 1.5%).
| Demographics | Rating | Rank | Female Poverty Among 18-24 Year Olds |
| Immigrants | Kuwait | 0.0 /100 | #305 | Tragic 23.0% |
| Paiute | 0.0 /100 | #306 | Tragic 23.3% |
| Cree | 0.0 /100 | #307 | Tragic 23.4% |
| Immigrants | Sudan | 0.0 /100 | #308 | Tragic 23.5% |
| Blackfeet | 0.0 /100 | #309 | Tragic 23.6% |
| Comanche | 0.0 /100 | #310 | Tragic 23.6% |
| Potawatomi | 0.0 /100 | #311 | Tragic 23.7% |
| Yuman | 0.0 /100 | #312 | Tragic 24.0% |
| Creek | 0.0 /100 | #313 | Tragic 24.2% |
| Choctaw | 0.0 /100 | #314 | Tragic 24.3% |
| Blacks/African Americans | 0.0 /100 | #315 | Tragic 24.3% |
| Alsatians | 0.0 /100 | #316 | Tragic 24.4% |
| Osage | 0.0 /100 | #317 | Tragic 24.5% |
| Chickasaw | 0.0 /100 | #318 | Tragic 24.5% |
| Dutch West Indians | 0.0 /100 | #319 | Tragic 24.5% |
Demographics Similar to Assyrians/Chaldeans/Syriacs by Female Poverty Among 18-24 Year Olds
In terms of female poverty among 18-24 year olds, the demographic groups most similar to Assyrians/Chaldeans/Syriacs are Chinese (16.2%, a difference of 17.9%), Immigrants from Cuba (16.4%, a difference of 19.8%), Immigrants from India (16.4%, a difference of 19.9%), Immigrants from Portugal (16.5%, a difference of 20.7%), and Immigrants from Philippines (16.7%, a difference of 21.6%).
| Demographics | Rating | Rank | Female Poverty Among 18-24 Year Olds |
| Assyrians/Chaldeans/Syriacs | 100.0 /100 | #1 | Exceptional 13.7% |
| Chinese | 100.0 /100 | #2 | Exceptional 16.2% |
| Immigrants | Cuba | 100.0 /100 | #3 | Exceptional 16.4% |
| Immigrants | India | 100.0 /100 | #4 | Exceptional 16.4% |
| Immigrants | Portugal | 100.0 /100 | #5 | Exceptional 16.5% |
| Immigrants | Philippines | 100.0 /100 | #6 | Exceptional 16.7% |
| Immigrants | Azores | 100.0 /100 | #7 | Exceptional 16.7% |
| Immigrants | Bolivia | 100.0 /100 | #8 | Exceptional 16.7% |
| Immigrants | Peru | 100.0 /100 | #9 | Exceptional 16.9% |
| Koreans | 100.0 /100 | #10 | Exceptional 16.9% |
| Thais | 100.0 /100 | #11 | Exceptional 17.0% |
| Immigrants | Pakistan | 100.0 /100 | #12 | Exceptional 17.0% |
| Immigrants | Poland | 100.0 /100 | #13 | Exceptional 17.1% |
| Tongans | 100.0 /100 | #14 | Exceptional 17.1% |
| Cubans | 100.0 /100 | #15 | Exceptional 17.2% |