Yaqui vs Taiwanese Seniors Poverty Over the Age of 75
COMPARE
Yaqui
Taiwanese
Seniors Poverty Over the Age of 75
Seniors Poverty Over the Age of 75 Comparison
Yaqui
Taiwanese
12.5%
SENIORS POVERTY OVER THE AGE OF 75
25.9/ 100
METRIC RATING
187th/ 347
METRIC RANK
12.6%
SENIORS POVERTY OVER THE AGE OF 75
17.8/ 100
METRIC RATING
193rd/ 347
METRIC RANK
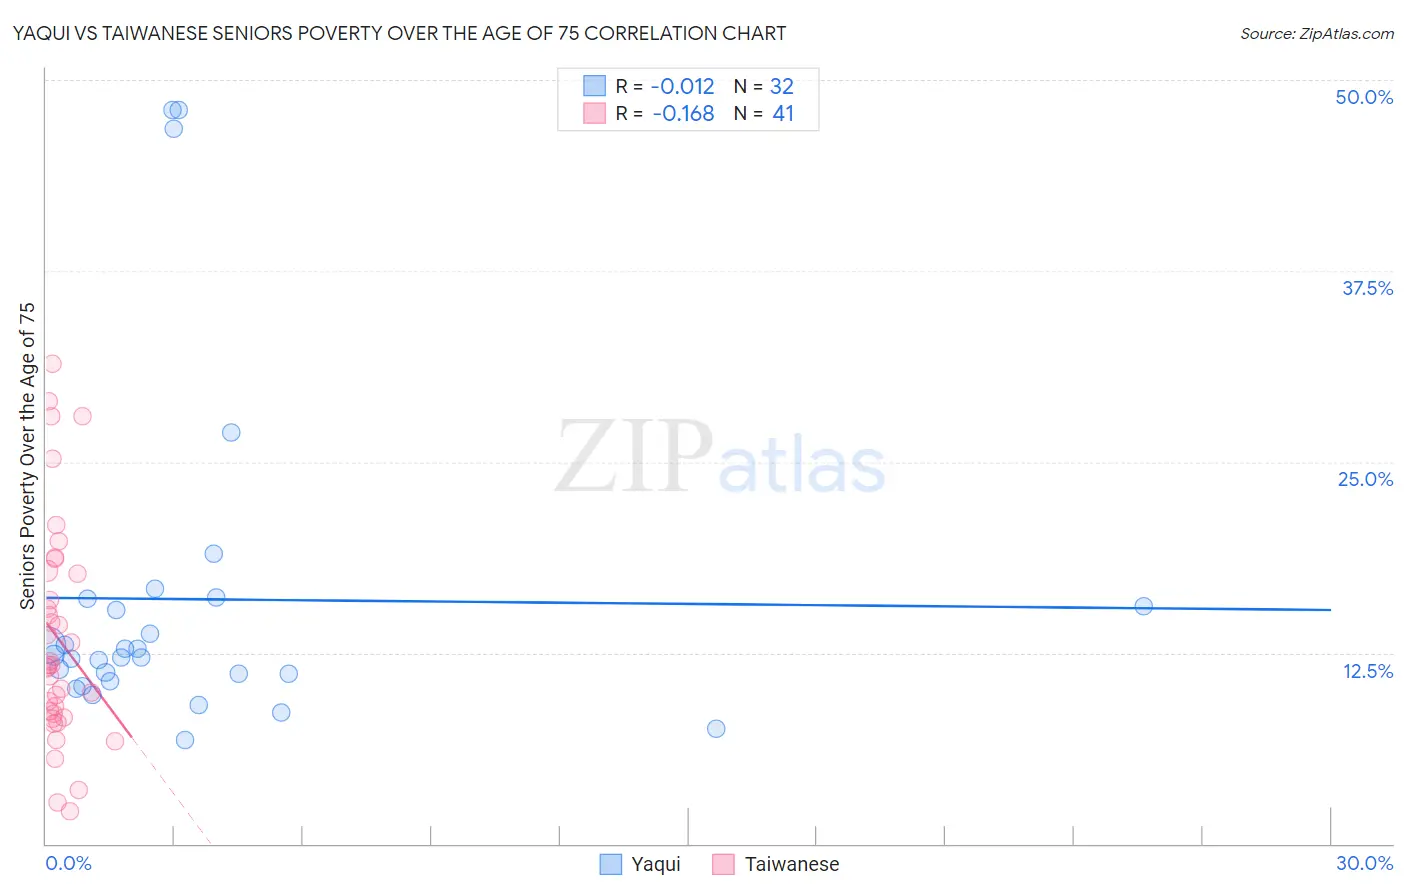
Yaqui vs Taiwanese Seniors Poverty Over the Age of 75 Correlation Chart
The statistical analysis conducted on geographies consisting of 107,262,070 people shows no correlation between the proportion of Yaqui and poverty level among seniors over the age of 75 in the United States with a correlation coefficient (R) of -0.012 and weighted average of 12.5%. Similarly, the statistical analysis conducted on geographies consisting of 31,695,905 people shows a poor negative correlation between the proportion of Taiwanese and poverty level among seniors over the age of 75 in the United States with a correlation coefficient (R) of -0.168 and weighted average of 12.6%, a difference of 0.95%.
Seniors Poverty Over the Age of 75 Correlation Summary
| Measurement | Yaqui | Taiwanese |
| Minimum | 6.8% | 2.1% |
| Maximum | 48.0% | 31.5% |
| Range | 41.2% | 29.3% |
| Mean | 16.0% | 13.5% |
| Median | 12.3% | 11.7% |
| Interquartile 25% (IQ1) | 10.9% | 8.4% |
| Interquartile 75% (IQ3) | 15.8% | 17.8% |
| Interquartile Range (IQR) | 4.9% | 9.4% |
| Standard Deviation (Sample) | 11.0% | 7.2% |
| Standard Deviation (Population) | 10.8% | 7.1% |
Demographics Similar to Yaqui and Taiwanese by Seniors Poverty Over the Age of 75
In terms of seniors poverty over the age of 75, the demographic groups most similar to Yaqui are Immigrants from Northern Africa (12.5%, a difference of 0.070%), Immigrants from Indonesia (12.5%, a difference of 0.15%), Immigrants from Congo (12.5%, a difference of 0.21%), Liberian (12.5%, a difference of 0.29%), and Sri Lankan (12.4%, a difference of 0.63%). Similarly, the demographic groups most similar to Taiwanese are Alsatian (12.6%, a difference of 0.010%), Immigrants from France (12.6%, a difference of 0.060%), Immigrants from Eastern Europe (12.6%, a difference of 0.24%), Choctaw (12.5%, a difference of 0.31%), and Nepalese (12.6%, a difference of 0.50%).
| Demographics | Rating | Rank | Seniors Poverty Over the Age of 75 |
| Immigrants | South Eastern Asia | 44.3 /100 | #180 | Average 12.2% |
| Immigrants | Australia | 44.2 /100 | #181 | Average 12.2% |
| German Russians | 41.4 /100 | #182 | Average 12.3% |
| Laotians | 38.2 /100 | #183 | Fair 12.3% |
| Kiowa | 36.0 /100 | #184 | Fair 12.3% |
| Immigrants | Malaysia | 35.8 /100 | #185 | Fair 12.3% |
| Sri Lankans | 32.3 /100 | #186 | Fair 12.4% |
| Yaqui | 25.9 /100 | #187 | Fair 12.5% |
| Immigrants | Northern Africa | 25.2 /100 | #188 | Fair 12.5% |
| Immigrants | Indonesia | 24.4 /100 | #189 | Fair 12.5% |
| Immigrants | Congo | 23.9 /100 | #190 | Fair 12.5% |
| Liberians | 23.2 /100 | #191 | Fair 12.5% |
| Choctaw | 20.2 /100 | #192 | Fair 12.5% |
| Taiwanese | 17.8 /100 | #193 | Poor 12.6% |
| Alsatians | 17.7 /100 | #194 | Poor 12.6% |
| Immigrants | France | 17.4 /100 | #195 | Poor 12.6% |
| Immigrants | Eastern Europe | 16.0 /100 | #196 | Poor 12.6% |
| Nepalese | 14.4 /100 | #197 | Poor 12.6% |
| Chileans | 13.7 /100 | #198 | Poor 12.6% |
| Immigrants | Lebanon | 12.7 /100 | #199 | Poor 12.7% |
| Immigrants | Vietnam | 12.1 /100 | #200 | Poor 12.7% |