Dutch vs Taiwanese Seniors Poverty Over the Age of 75
COMPARE
Dutch
Taiwanese
Seniors Poverty Over the Age of 75
Seniors Poverty Over the Age of 75 Comparison
Dutch
Taiwanese
10.5%
SENIORS POVERTY OVER THE AGE OF 75
99.9/ 100
METRIC RATING
16th/ 347
METRIC RANK
12.6%
SENIORS POVERTY OVER THE AGE OF 75
17.8/ 100
METRIC RATING
193rd/ 347
METRIC RANK
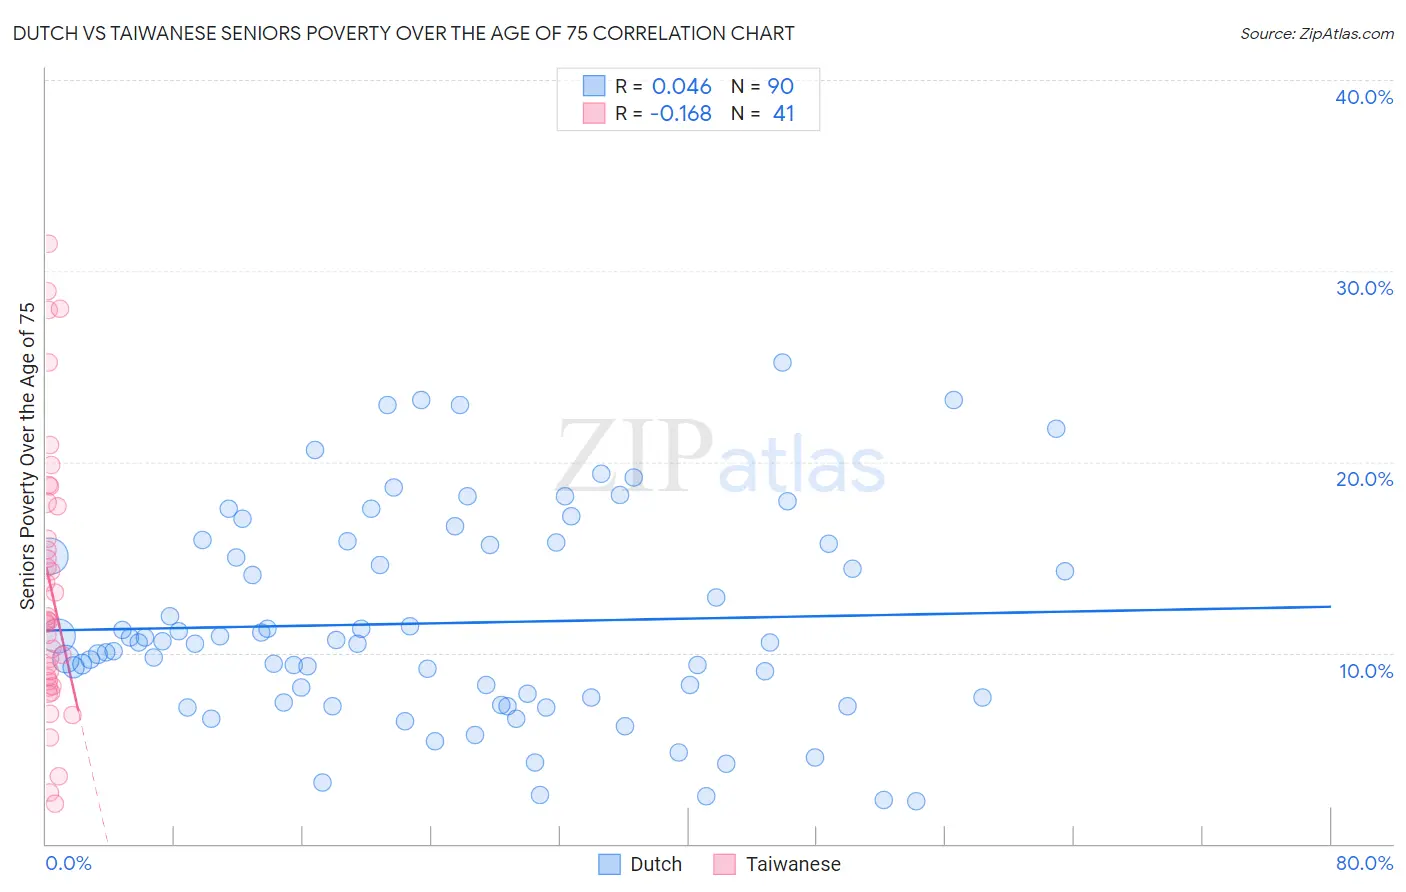
Dutch vs Taiwanese Seniors Poverty Over the Age of 75 Correlation Chart
The statistical analysis conducted on geographies consisting of 539,215,088 people shows no correlation between the proportion of Dutch and poverty level among seniors over the age of 75 in the United States with a correlation coefficient (R) of 0.046 and weighted average of 10.5%. Similarly, the statistical analysis conducted on geographies consisting of 31,695,905 people shows a poor negative correlation between the proportion of Taiwanese and poverty level among seniors over the age of 75 in the United States with a correlation coefficient (R) of -0.168 and weighted average of 12.6%, a difference of 19.5%.
Seniors Poverty Over the Age of 75 Correlation Summary
| Measurement | Dutch | Taiwanese |
| Minimum | 2.2% | 2.1% |
| Maximum | 25.2% | 31.5% |
| Range | 23.0% | 29.3% |
| Mean | 11.6% | 13.5% |
| Median | 10.5% | 11.7% |
| Interquartile 25% (IQ1) | 7.6% | 8.4% |
| Interquartile 75% (IQ3) | 15.7% | 17.8% |
| Interquartile Range (IQR) | 8.1% | 9.4% |
| Standard Deviation (Sample) | 5.4% | 7.2% |
| Standard Deviation (Population) | 5.4% | 7.1% |
Similar Demographics by Seniors Poverty Over the Age of 75
Demographics Similar to Dutch by Seniors Poverty Over the Age of 75
In terms of seniors poverty over the age of 75, the demographic groups most similar to Dutch are Scottish (10.5%, a difference of 0.12%), European (10.5%, a difference of 0.12%), Slovak (10.5%, a difference of 0.21%), Welsh (10.5%, a difference of 0.21%), and Immigrants from Scotland (10.5%, a difference of 0.25%).
| Demographics | Rating | Rank | Seniors Poverty Over the Age of 75 |
| English | 99.9 /100 | #9 | Exceptional 10.4% |
| Scandinavians | 99.9 /100 | #10 | Exceptional 10.4% |
| Immigrants | India | 99.9 /100 | #11 | Exceptional 10.4% |
| Tongans | 99.9 /100 | #12 | Exceptional 10.5% |
| Croatians | 99.9 /100 | #13 | Exceptional 10.5% |
| Scottish | 99.9 /100 | #14 | Exceptional 10.5% |
| Europeans | 99.9 /100 | #15 | Exceptional 10.5% |
| Dutch | 99.9 /100 | #16 | Exceptional 10.5% |
| Slovaks | 99.9 /100 | #17 | Exceptional 10.5% |
| Welsh | 99.9 /100 | #18 | Exceptional 10.5% |
| Immigrants | Scotland | 99.9 /100 | #19 | Exceptional 10.5% |
| Czechs | 99.9 /100 | #20 | Exceptional 10.5% |
| Slovenes | 99.9 /100 | #21 | Exceptional 10.6% |
| Bhutanese | 99.8 /100 | #22 | Exceptional 10.6% |
| Lithuanians | 99.8 /100 | #23 | Exceptional 10.6% |
Demographics Similar to Taiwanese by Seniors Poverty Over the Age of 75
In terms of seniors poverty over the age of 75, the demographic groups most similar to Taiwanese are Alsatian (12.6%, a difference of 0.010%), Immigrants from France (12.6%, a difference of 0.060%), Immigrants from Eastern Europe (12.6%, a difference of 0.24%), Choctaw (12.5%, a difference of 0.31%), and Nepalese (12.6%, a difference of 0.50%).
| Demographics | Rating | Rank | Seniors Poverty Over the Age of 75 |
| Sri Lankans | 32.3 /100 | #186 | Fair 12.4% |
| Yaqui | 25.9 /100 | #187 | Fair 12.5% |
| Immigrants | Northern Africa | 25.2 /100 | #188 | Fair 12.5% |
| Immigrants | Indonesia | 24.4 /100 | #189 | Fair 12.5% |
| Immigrants | Congo | 23.9 /100 | #190 | Fair 12.5% |
| Liberians | 23.2 /100 | #191 | Fair 12.5% |
| Choctaw | 20.2 /100 | #192 | Fair 12.5% |
| Taiwanese | 17.8 /100 | #193 | Poor 12.6% |
| Alsatians | 17.7 /100 | #194 | Poor 12.6% |
| Immigrants | France | 17.4 /100 | #195 | Poor 12.6% |
| Immigrants | Eastern Europe | 16.0 /100 | #196 | Poor 12.6% |
| Nepalese | 14.4 /100 | #197 | Poor 12.6% |
| Chileans | 13.7 /100 | #198 | Poor 12.6% |
| Immigrants | Lebanon | 12.7 /100 | #199 | Poor 12.7% |
| Immigrants | Vietnam | 12.1 /100 | #200 | Poor 12.7% |