Yaqui vs Immigrants from Middle Africa Child Poverty Among Boys Under 16
COMPARE
Yaqui
Immigrants from Middle Africa
Child Poverty Among Boys Under 16
Child Poverty Among Boys Under 16 Comparison
Yaqui
Immigrants from Middle Africa
20.7%
CHILD POVERTY AMONG BOYS UNDER 16
0.0/ 100
METRIC RATING
292nd/ 347
METRIC RANK
18.9%
CHILD POVERTY AMONG BOYS UNDER 16
0.4/ 100
METRIC RATING
244th/ 347
METRIC RANK
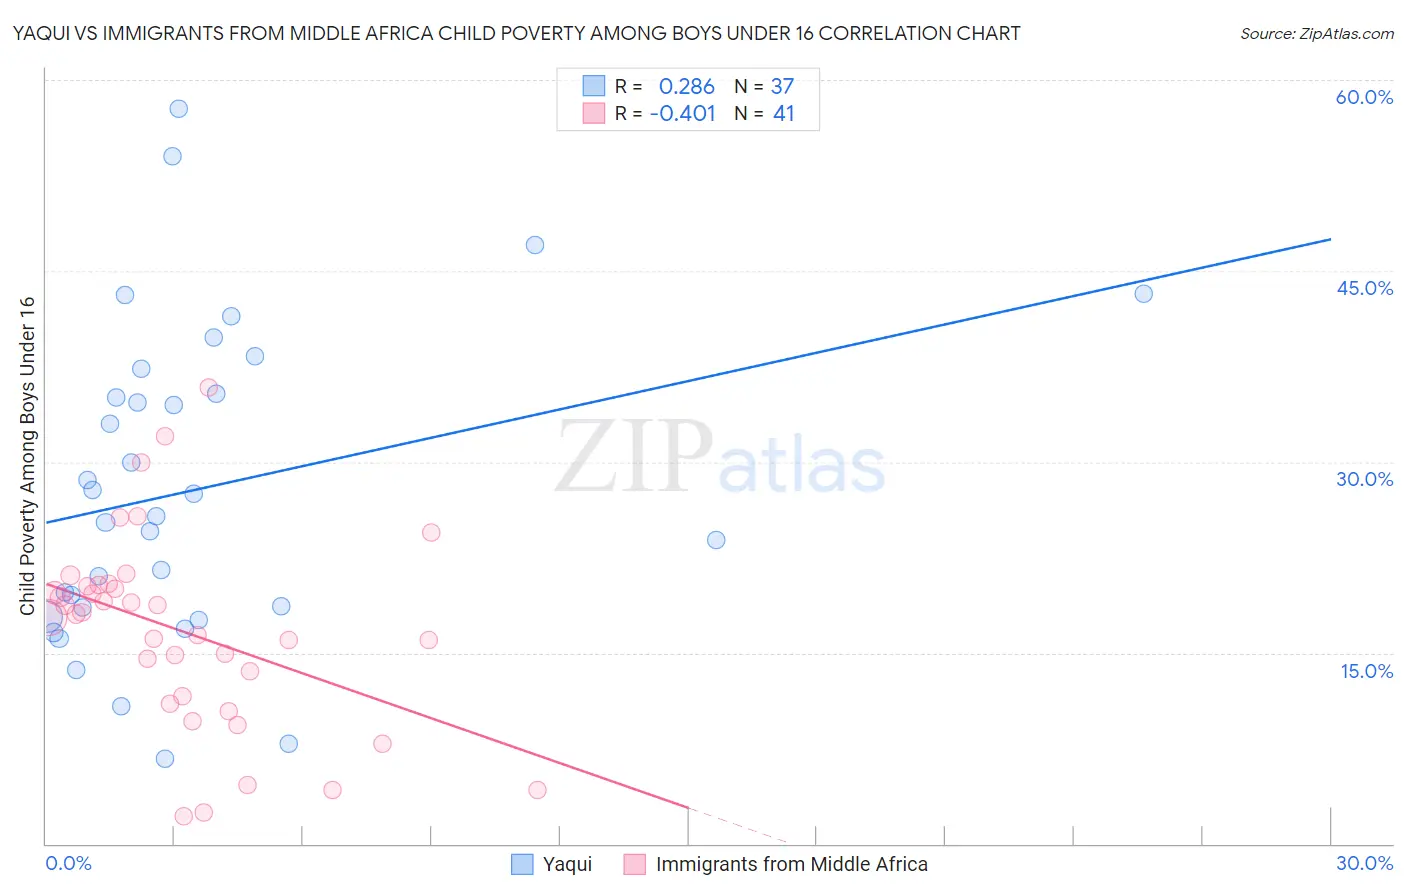
Yaqui vs Immigrants from Middle Africa Child Poverty Among Boys Under 16 Correlation Chart
The statistical analysis conducted on geographies consisting of 107,428,472 people shows a weak positive correlation between the proportion of Yaqui and poverty level among boys under the age of 16 in the United States with a correlation coefficient (R) of 0.286 and weighted average of 20.7%. Similarly, the statistical analysis conducted on geographies consisting of 201,664,173 people shows a moderate negative correlation between the proportion of Immigrants from Middle Africa and poverty level among boys under the age of 16 in the United States with a correlation coefficient (R) of -0.401 and weighted average of 18.9%, a difference of 9.2%.
Child Poverty Among Boys Under 16 Correlation Summary
| Measurement | Yaqui | Immigrants from Middle Africa |
| Minimum | 6.7% | 2.2% |
| Maximum | 57.8% | 35.8% |
| Range | 51.1% | 33.6% |
| Mean | 27.9% | 16.7% |
| Median | 25.7% | 18.0% |
| Interquartile 25% (IQ1) | 18.2% | 11.3% |
| Interquartile 75% (IQ3) | 36.3% | 20.3% |
| Interquartile Range (IQR) | 18.1% | 9.0% |
| Standard Deviation (Sample) | 12.4% | 7.6% |
| Standard Deviation (Population) | 12.2% | 7.5% |
Similar Demographics by Child Poverty Among Boys Under 16
Demographics Similar to Yaqui by Child Poverty Among Boys Under 16
In terms of child poverty among boys under 16, the demographic groups most similar to Yaqui are Immigrants from Senegal (20.7%, a difference of 0.010%), Immigrants from Bahamas (20.7%, a difference of 0.13%), Mexican (20.7%, a difference of 0.25%), Immigrants from Latin America (20.6%, a difference of 0.26%), and Indonesian (20.8%, a difference of 0.45%).
| Demographics | Rating | Rank | Child Poverty Among Boys Under 16 |
| Arapaho | 0.0 /100 | #285 | Tragic 20.2% |
| West Indians | 0.0 /100 | #286 | Tragic 20.3% |
| Immigrants | Belize | 0.0 /100 | #287 | Tragic 20.3% |
| Immigrants | St. Vincent and the Grenadines | 0.0 /100 | #288 | Tragic 20.3% |
| Blackfeet | 0.0 /100 | #289 | Tragic 20.4% |
| Senegalese | 0.0 /100 | #290 | Tragic 20.6% |
| Immigrants | Latin America | 0.0 /100 | #291 | Tragic 20.6% |
| Yaqui | 0.0 /100 | #292 | Tragic 20.7% |
| Immigrants | Senegal | 0.0 /100 | #293 | Tragic 20.7% |
| Immigrants | Bahamas | 0.0 /100 | #294 | Tragic 20.7% |
| Mexicans | 0.0 /100 | #295 | Tragic 20.7% |
| Indonesians | 0.0 /100 | #296 | Tragic 20.8% |
| Hispanics or Latinos | 0.0 /100 | #297 | Tragic 20.9% |
| Chippewa | 0.0 /100 | #298 | Tragic 21.0% |
| Immigrants | Caribbean | 0.0 /100 | #299 | Tragic 21.0% |
Demographics Similar to Immigrants from Middle Africa by Child Poverty Among Boys Under 16
In terms of child poverty among boys under 16, the demographic groups most similar to Immigrants from Middle Africa are Immigrants from the Azores (18.9%, a difference of 0.010%), Cree (19.0%, a difference of 0.13%), Immigrants from Nicaragua (19.0%, a difference of 0.33%), Ghanaian (18.9%, a difference of 0.35%), and Immigrants from Trinidad and Tobago (19.0%, a difference of 0.45%).
| Demographics | Rating | Rank | Child Poverty Among Boys Under 16 |
| Immigrants | Eritrea | 0.8 /100 | #237 | Tragic 18.6% |
| Immigrants | Laos | 0.8 /100 | #238 | Tragic 18.7% |
| Cape Verdeans | 0.7 /100 | #239 | Tragic 18.7% |
| Immigrants | Cuba | 0.6 /100 | #240 | Tragic 18.8% |
| Immigrants | Sudan | 0.6 /100 | #241 | Tragic 18.8% |
| Ghanaians | 0.5 /100 | #242 | Tragic 18.9% |
| Immigrants | Azores | 0.4 /100 | #243 | Tragic 18.9% |
| Immigrants | Middle Africa | 0.4 /100 | #244 | Tragic 18.9% |
| Cree | 0.4 /100 | #245 | Tragic 19.0% |
| Immigrants | Nicaragua | 0.4 /100 | #246 | Tragic 19.0% |
| Immigrants | Trinidad and Tobago | 0.3 /100 | #247 | Tragic 19.0% |
| Salvadorans | 0.3 /100 | #248 | Tragic 19.0% |
| Alsatians | 0.3 /100 | #249 | Tragic 19.1% |
| Immigrants | Burma/Myanmar | 0.2 /100 | #250 | Tragic 19.2% |
| French American Indians | 0.2 /100 | #251 | Tragic 19.2% |