Yaqui vs Irish Family Poverty
COMPARE
Yaqui
Irish
Family Poverty
Family Poverty Comparison
Yaqui
Irish
11.3%
FAMILY POVERTY
0.0/ 100
METRIC RATING
284th/ 347
METRIC RANK
7.9%
FAMILY POVERTY
97.8/ 100
METRIC RATING
81st/ 347
METRIC RANK
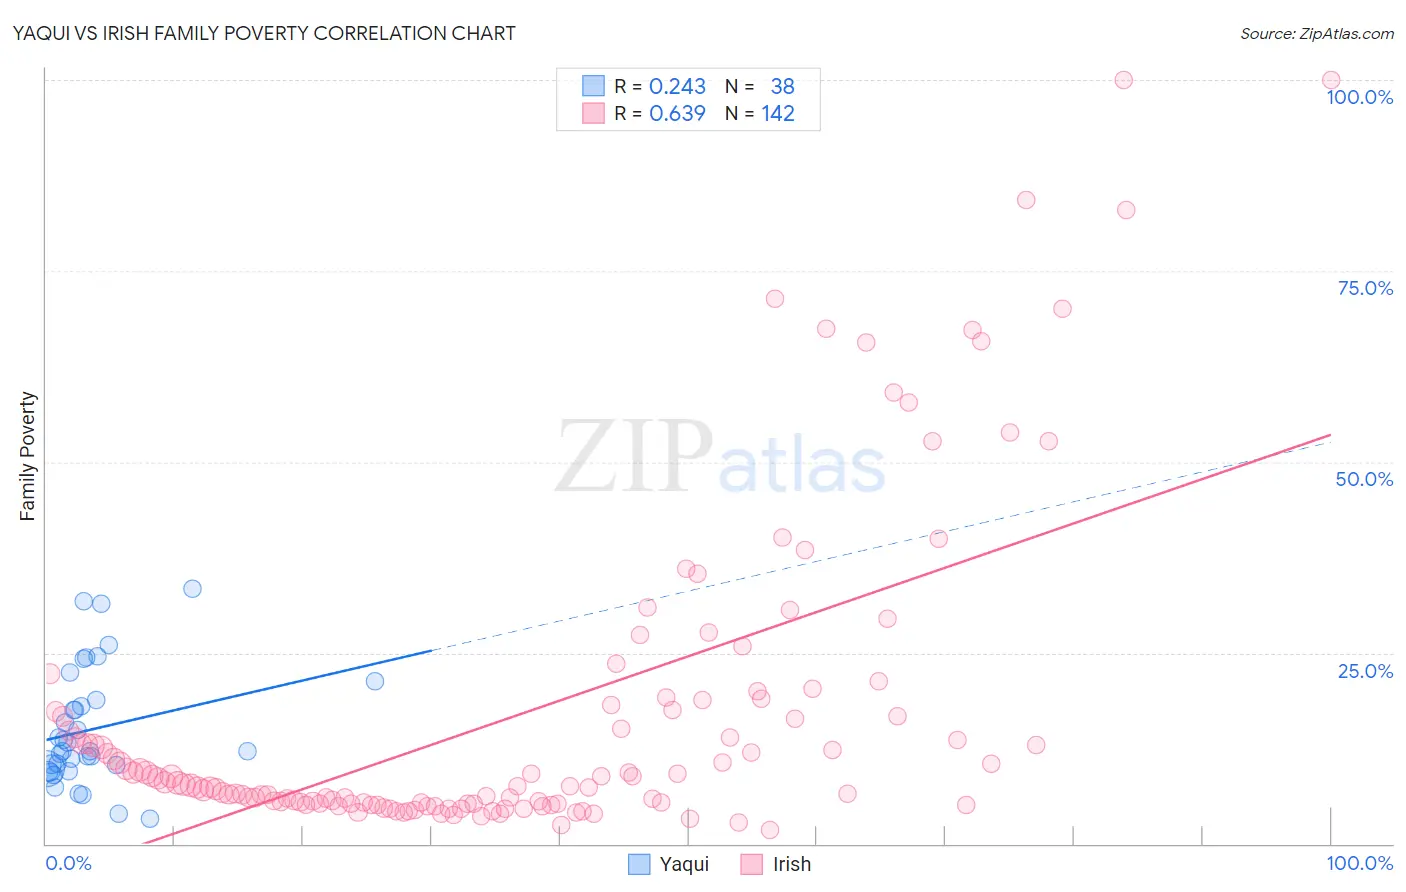
Yaqui vs Irish Family Poverty Correlation Chart
The statistical analysis conducted on geographies consisting of 107,688,240 people shows a weak positive correlation between the proportion of Yaqui and poverty level among families in the United States with a correlation coefficient (R) of 0.243 and weighted average of 11.3%. Similarly, the statistical analysis conducted on geographies consisting of 574,608,080 people shows a significant positive correlation between the proportion of Irish and poverty level among families in the United States with a correlation coefficient (R) of 0.639 and weighted average of 7.9%, a difference of 43.8%.
Family Poverty Correlation Summary
| Measurement | Yaqui | Irish |
| Minimum | 3.3% | 1.7% |
| Maximum | 33.3% | 100.0% |
| Range | 30.0% | 98.3% |
| Mean | 15.0% | 16.9% |
| Median | 12.2% | 7.9% |
| Interquartile 25% (IQ1) | 9.8% | 5.2% |
| Interquartile 75% (IQ3) | 18.8% | 17.5% |
| Interquartile Range (IQR) | 8.9% | 12.2% |
| Standard Deviation (Sample) | 7.6% | 20.6% |
| Standard Deviation (Population) | 7.5% | 20.5% |
Similar Demographics by Family Poverty
Demographics Similar to Yaqui by Family Poverty
In terms of family poverty, the demographic groups most similar to Yaqui are Barbadian (11.3%, a difference of 0.080%), Indonesian (11.3%, a difference of 0.12%), Immigrants from Cuba (11.3%, a difference of 0.16%), Immigrants from West Indies (11.3%, a difference of 0.42%), and Belizean (11.3%, a difference of 0.69%).
| Demographics | Rating | Rank | Family Poverty |
| Chippewa | 0.1 /100 | #277 | Tragic 11.2% |
| Guyanese | 0.1 /100 | #278 | Tragic 11.2% |
| Blackfeet | 0.0 /100 | #279 | Tragic 11.3% |
| Belizeans | 0.0 /100 | #280 | Tragic 11.3% |
| Immigrants | West Indies | 0.0 /100 | #281 | Tragic 11.3% |
| Immigrants | Cuba | 0.0 /100 | #282 | Tragic 11.3% |
| Indonesians | 0.0 /100 | #283 | Tragic 11.3% |
| Yaqui | 0.0 /100 | #284 | Tragic 11.3% |
| Barbadians | 0.0 /100 | #285 | Tragic 11.3% |
| Senegalese | 0.0 /100 | #286 | Tragic 11.5% |
| Vietnamese | 0.0 /100 | #287 | Tragic 11.5% |
| Immigrants | Belize | 0.0 /100 | #288 | Tragic 11.5% |
| Immigrants | Barbados | 0.0 /100 | #289 | Tragic 11.5% |
| West Indians | 0.0 /100 | #290 | Tragic 11.5% |
| Haitians | 0.0 /100 | #291 | Tragic 11.5% |
Demographics Similar to Irish by Family Poverty
In terms of family poverty, the demographic groups most similar to Irish are English (7.9%, a difference of 0.010%), Immigrants from Poland (7.9%, a difference of 0.030%), Immigrants from Europe (7.9%, a difference of 0.070%), Immigrants from North America (7.9%, a difference of 0.15%), and Slovak (7.9%, a difference of 0.20%).
| Demographics | Rating | Rank | Family Poverty |
| Immigrants | China | 98.1 /100 | #74 | Exceptional 7.8% |
| Immigrants | Croatia | 98.1 /100 | #75 | Exceptional 7.8% |
| Immigrants | Latvia | 98.0 /100 | #76 | Exceptional 7.9% |
| Ukrainians | 98.0 /100 | #77 | Exceptional 7.9% |
| Immigrants | North America | 97.9 /100 | #78 | Exceptional 7.9% |
| Immigrants | Europe | 97.8 /100 | #79 | Exceptional 7.9% |
| English | 97.8 /100 | #80 | Exceptional 7.9% |
| Irish | 97.8 /100 | #81 | Exceptional 7.9% |
| Immigrants | Poland | 97.8 /100 | #82 | Exceptional 7.9% |
| Slovaks | 97.7 /100 | #83 | Exceptional 7.9% |
| British | 97.5 /100 | #84 | Exceptional 7.9% |
| Immigrants | Asia | 97.4 /100 | #85 | Exceptional 7.9% |
| Scottish | 97.3 /100 | #86 | Exceptional 7.9% |
| Belgians | 97.3 /100 | #87 | Exceptional 8.0% |
| Serbians | 97.2 /100 | #88 | Exceptional 8.0% |