Yakama vs Immigrants from Western Africa Seniors Poverty Over the Age of 75
COMPARE
Yakama
Immigrants from Western Africa
Seniors Poverty Over the Age of 75
Seniors Poverty Over the Age of 75 Comparison
Yakama
Immigrants from Western Africa
18.3%
SENIORS POVERTY OVER THE AGE OF 75
0.0/ 100
METRIC RATING
337th/ 347
METRIC RANK
13.9%
SENIORS POVERTY OVER THE AGE OF 75
0.1/ 100
METRIC RATING
257th/ 347
METRIC RANK
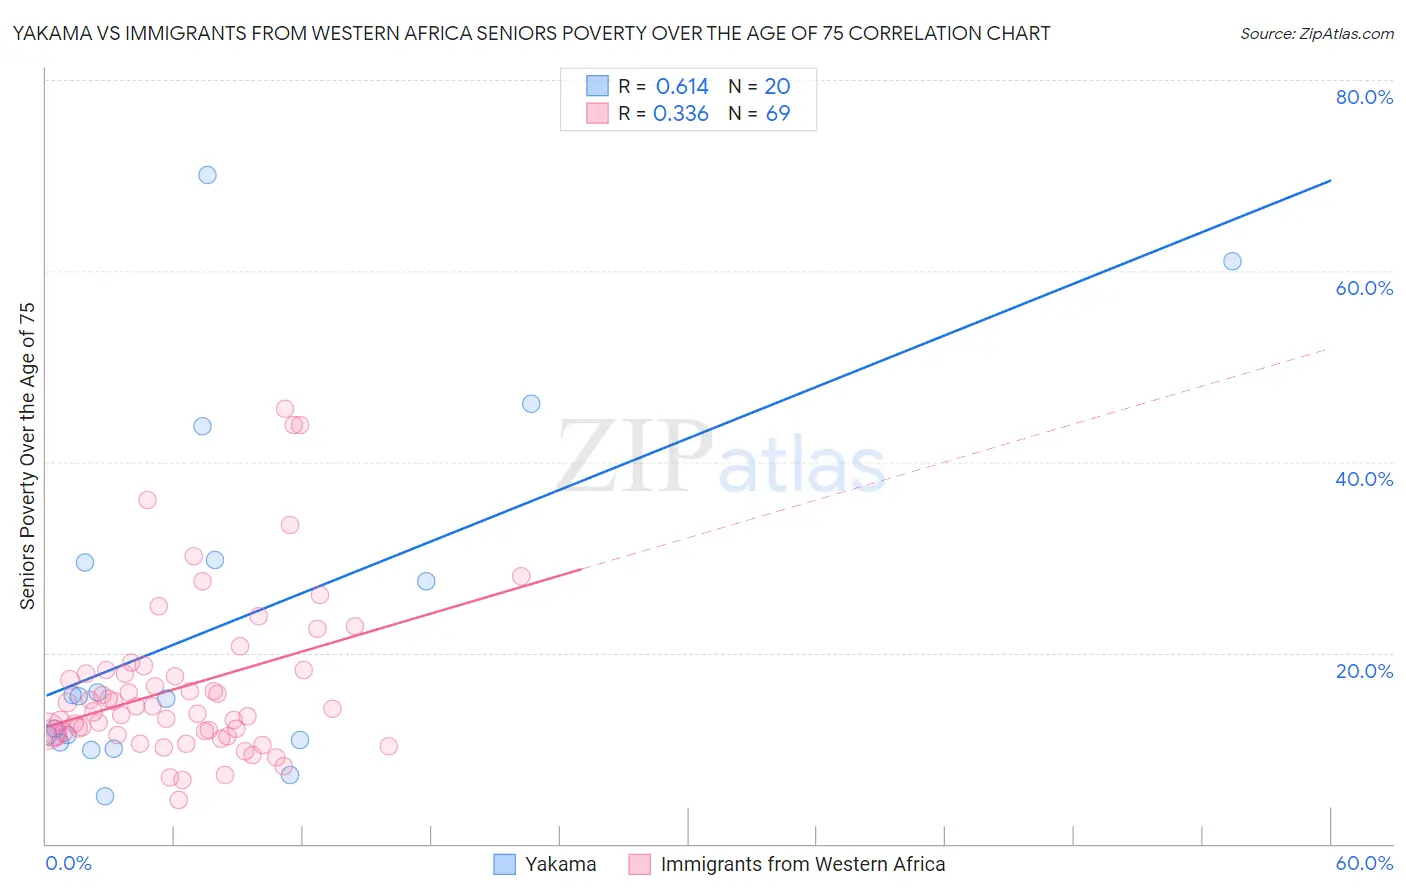
Yakama vs Immigrants from Western Africa Seniors Poverty Over the Age of 75 Correlation Chart
The statistical analysis conducted on geographies consisting of 19,834,385 people shows a significant positive correlation between the proportion of Yakama and poverty level among seniors over the age of 75 in the United States with a correlation coefficient (R) of 0.614 and weighted average of 18.3%. Similarly, the statistical analysis conducted on geographies consisting of 353,988,871 people shows a mild positive correlation between the proportion of Immigrants from Western Africa and poverty level among seniors over the age of 75 in the United States with a correlation coefficient (R) of 0.336 and weighted average of 13.9%, a difference of 31.6%.
Seniors Poverty Over the Age of 75 Correlation Summary
| Measurement | Yakama | Immigrants from Western Africa |
| Minimum | 5.0% | 4.5% |
| Maximum | 70.0% | 45.5% |
| Range | 65.0% | 41.0% |
| Mean | 22.9% | 16.6% |
| Median | 15.3% | 14.1% |
| Interquartile 25% (IQ1) | 10.8% | 11.5% |
| Interquartile 75% (IQ3) | 29.6% | 18.2% |
| Interquartile Range (IQR) | 18.8% | 6.8% |
| Standard Deviation (Sample) | 18.6% | 8.6% |
| Standard Deviation (Population) | 18.1% | 8.5% |
Similar Demographics by Seniors Poverty Over the Age of 75
Demographics Similar to Yakama by Seniors Poverty Over the Age of 75
In terms of seniors poverty over the age of 75, the demographic groups most similar to Yakama are Immigrants from Caribbean (18.2%, a difference of 0.40%), Immigrants from Cabo Verde (18.5%, a difference of 0.97%), Cuban (18.0%, a difference of 2.1%), Immigrants from Grenada (17.8%, a difference of 2.6%), and Hopi (18.9%, a difference of 2.9%).
| Demographics | Rating | Rank | Seniors Poverty Over the Age of 75 |
| British West Indians | 0.0 /100 | #330 | Tragic 17.4% |
| Immigrants | Armenia | 0.0 /100 | #331 | Tragic 17.5% |
| Immigrants | St. Vincent and the Grenadines | 0.0 /100 | #332 | Tragic 17.5% |
| Immigrants | Nicaragua | 0.0 /100 | #333 | Tragic 17.6% |
| Immigrants | Grenada | 0.0 /100 | #334 | Tragic 17.8% |
| Cubans | 0.0 /100 | #335 | Tragic 18.0% |
| Immigrants | Caribbean | 0.0 /100 | #336 | Tragic 18.2% |
| Yakama | 0.0 /100 | #337 | Tragic 18.3% |
| Immigrants | Cabo Verde | 0.0 /100 | #338 | Tragic 18.5% |
| Hopi | 0.0 /100 | #339 | Tragic 18.9% |
| Tohono O'odham | 0.0 /100 | #340 | Tragic 19.1% |
| Navajo | 0.0 /100 | #341 | Tragic 19.4% |
| Dominicans | 0.0 /100 | #342 | Tragic 19.6% |
| Lumbee | 0.0 /100 | #343 | Tragic 19.7% |
| Immigrants | Cuba | 0.0 /100 | #344 | Tragic 19.9% |
Demographics Similar to Immigrants from Western Africa by Seniors Poverty Over the Age of 75
In terms of seniors poverty over the age of 75, the demographic groups most similar to Immigrants from Western Africa are Immigrants from Panama (13.9%, a difference of 0.090%), Immigrants from Portugal (13.9%, a difference of 0.13%), Immigrants (13.9%, a difference of 0.20%), Ghanaian (14.0%, a difference of 0.30%), and Cajun (14.0%, a difference of 0.53%).
| Demographics | Rating | Rank | Seniors Poverty Over the Age of 75 |
| Mexican American Indians | 0.3 /100 | #250 | Tragic 13.6% |
| Immigrants | Peru | 0.3 /100 | #251 | Tragic 13.7% |
| Immigrants | Argentina | 0.3 /100 | #252 | Tragic 13.7% |
| Immigrants | Spain | 0.2 /100 | #253 | Tragic 13.7% |
| Blackfeet | 0.2 /100 | #254 | Tragic 13.7% |
| Immigrants | Belarus | 0.2 /100 | #255 | Tragic 13.8% |
| Inupiat | 0.1 /100 | #256 | Tragic 13.8% |
| Immigrants | Western Africa | 0.1 /100 | #257 | Tragic 13.9% |
| Immigrants | Panama | 0.1 /100 | #258 | Tragic 13.9% |
| Immigrants | Portugal | 0.1 /100 | #259 | Tragic 13.9% |
| Immigrants | Immigrants | 0.1 /100 | #260 | Tragic 13.9% |
| Ghanaians | 0.1 /100 | #261 | Tragic 14.0% |
| Cajuns | 0.1 /100 | #262 | Tragic 14.0% |
| Iroquois | 0.1 /100 | #263 | Tragic 14.0% |
| South Americans | 0.0 /100 | #264 | Tragic 14.1% |