Immigrants from Scotland vs Immigrants from Western Africa Seniors Poverty Over the Age of 75

COMPARE

Immigrants from Scotland
Race
Ancestry
AfghanAfricanAlaska NativeAlaskan AthabascanAlbanianAleutAlsatianAmericanApacheArabArapahoArgentineanArmenianAssyrian/Chaldean/SyriacAustralianAustrianBahamianBangladeshiBarbadianBasqueBelgianBelizeanBermudanBhutaneseBlackfeetBolivianBrazilianBritishBritish West IndianBulgarianBurmeseCajunCambodianCanadianCape VerdeanCarpatho RusynCelticCentral AmericanCentral American IndianCherokeeCheyenneChickasawChileanChineseChippewaChoctawColombianColvilleComancheCosta RicanCreeCreekCroatianCrowCubanCypriotCzechCzechoslovakianDanishDelawareDominicanDutchDutch West IndianEastern EuropeanEcuadorianEgyptianEnglishEstonianEthiopianEuropeanFijianFilipinoFinnishFrenchFrench American IndianFrench CanadianGermanGerman RussianGhanaianGreekGuamanian/ChamorroGuatemalanGuyaneseHaitianHmongHonduranHopiHoumaHungarianIcelanderIndian (Asian)IndonesianInupiatIranianIraqiIrishIroquoisIsraeliItalianJamaicanJapaneseJordanianKenyanKiowaKoreanLaotianLatvianLebaneseLiberianLithuanianLumbeeLuxembourgerMacedonianMalaysianMalteseMarshalleseMenomineeMexicanMexican American IndianMongolianMoroccanNative HawaiianNavajoNepaleseNew ZealanderNicaraguanNigerianNorthern EuropeanNorwegianOkinawanOsageOttawaPaiutePakistaniPalestinianPanamanianParaguayanPennsylvania GermanPeruvianPimaPolishPortuguesePotawatomiPuebloPuerto RicanPuget Sound SalishRomanianRussianSalvadoranSamoanScandinavianScotch-IrishScottishSeminoleSenegaleseSerbianShoshoneSierra LeoneanSiouxSlavicSlovakSloveneSomaliSouth AfricanSouth AmericanSouth American IndianSoviet UnionSpaniardSpanishSpanish AmericanSpanish American IndianSri LankanSubsaharan AfricanSudaneseSwedishSwissSyrianTaiwaneseThaiTlingit-HaidaTohono O'OdhamTonganTrinidadian and TobagonianTsimshianTurkishU.S. Virgin IslanderUgandanUkrainianUruguayanUteVenezuelanVietnameseWelshWest IndianYakamaYaquiYugoslavianYumanYup'ikZimbabwean
Immigration
NonimmigrantsImmigrantsAfghanistanAfricaAlbaniaArgentinaArmeniaAsiaAustraliaAustriaBahamasBangladeshBarbadosBelarusBelgiumBelizeBoliviaBosnia and HerzegovinaBrazilBulgariaBurma/MyanmarCabo VerdeCambodiaCameroonCanadaCaribbeanCentral AmericaChileChinaColombiaCongoCosta RicaCroatiaCubaCzechoslovakiaDenmarkDominicaDominican RepublicEastern AfricaEastern AsiaEastern EuropeEcuadorEgyptEl SalvadorEnglandEritreaEthiopiaEuropeFijiFranceGermanyGhanaGreeceGrenadaGuatemalaGuyanaHaitiHondurasHong KongHungaryIndiaIndonesiaIranIraqIrelandIsraelItalyJamaicaJapanJordanKazakhstanKenyaKoreaKuwaitLaosLatin AmericaLatviaLebanonLiberiaLithuaniaMalaysiaMexicoMicronesiaMiddle AfricaMoldovaMoroccoNepalNetherlandsNicaraguaNigeriaNorth AmericaNorth MacedoniaNorthern AfricaNorthern EuropeNorwayOceaniaPakistanPanamaPeruPhilippinesPolandPortugalRomaniaRussiaSaudi ArabiaScotlandSenegalSerbiaSierra LeoneSingaporeSomaliaSouth AfricaSouth AmericaSouth Central AsiaSouth Eastern AsiaSouthern EuropeSpainSri LankaSt. Vincent and the GrenadinesSudanSwedenSwitzerlandSyriaTaiwanThailandTrinidad and TobagoTurkeyUgandaUkraineUruguayUzbekistanVenezuelaVietnamWest IndiesWestern AsiaWestern EuropeYemenZaireZimbabweAzores
Immigrants from Western Africa
Race
Ancestry
AfghanAfricanAlaska NativeAlaskan AthabascanAlbanianAleutAlsatianAmericanApacheArabArapahoArgentineanArmenianAssyrian/Chaldean/SyriacAustralianAustrianBahamianBangladeshiBarbadianBasqueBelgianBelizeanBermudanBhutaneseBlackfeetBolivianBrazilianBritishBritish West IndianBulgarianBurmeseCajunCambodianCanadianCape VerdeanCarpatho RusynCelticCentral AmericanCentral American IndianCherokeeCheyenneChickasawChileanChineseChippewaChoctawColombianColvilleComancheCosta RicanCreeCreekCroatianCrowCubanCypriotCzechCzechoslovakianDanishDelawareDominicanDutchDutch West IndianEastern EuropeanEcuadorianEgyptianEnglishEstonianEthiopianEuropeanFijianFilipinoFinnishFrenchFrench American IndianFrench CanadianGermanGerman RussianGhanaianGreekGuamanian/ChamorroGuatemalanGuyaneseHaitianHmongHonduranHopiHoumaHungarianIcelanderIndian (Asian)IndonesianInupiatIranianIraqiIrishIroquoisIsraeliItalianJamaicanJapaneseJordanianKenyanKiowaKoreanLaotianLatvianLebaneseLiberianLithuanianLumbeeLuxembourgerMacedonianMalaysianMalteseMarshalleseMenomineeMexicanMexican American IndianMongolianMoroccanNative HawaiianNavajoNepaleseNew ZealanderNicaraguanNigerianNorthern EuropeanNorwegianOkinawanOsageOttawaPaiutePakistaniPalestinianPanamanianParaguayanPennsylvania GermanPeruvianPimaPolishPortuguesePotawatomiPuebloPuerto RicanPuget Sound SalishRomanianRussianSalvadoranSamoanScandinavianScotch-IrishScottishSeminoleSenegaleseSerbianShoshoneSierra LeoneanSiouxSlavicSlovakSloveneSomaliSouth AfricanSouth AmericanSouth American IndianSoviet UnionSpaniardSpanishSpanish AmericanSpanish American IndianSri LankanSubsaharan AfricanSudaneseSwedishSwissSyrianTaiwaneseThaiTlingit-HaidaTohono O'OdhamTonganTrinidadian and TobagonianTsimshianTurkishU.S. Virgin IslanderUgandanUkrainianUruguayanUteVenezuelanVietnameseWelshWest IndianYakamaYaquiYugoslavianYumanYup'ikZimbabwean
Immigration
NonimmigrantsImmigrantsAfghanistanAfricaAlbaniaArgentinaArmeniaAsiaAustraliaAustriaBahamasBangladeshBarbadosBelarusBelgiumBelizeBoliviaBosnia and HerzegovinaBrazilBulgariaBurma/MyanmarCabo VerdeCambodiaCameroonCanadaCaribbeanCentral AmericaChileChinaColombiaCongoCosta RicaCroatiaCubaCzechoslovakiaDenmarkDominicaDominican RepublicEastern AfricaEastern AsiaEastern EuropeEcuadorEgyptEl SalvadorEnglandEritreaEthiopiaEuropeFijiFranceGermanyGhanaGreeceGrenadaGuatemalaGuyanaHaitiHondurasHong KongHungaryIndiaIndonesiaIranIraqIrelandIsraelItalyJamaicaJapanJordanKazakhstanKenyaKoreaKuwaitLaosLatin AmericaLatviaLebanonLiberiaLithuaniaMalaysiaMexicoMicronesiaMiddle AfricaMoldovaMoroccoNepalNetherlandsNicaraguaNigeriaNorth AmericaNorth MacedoniaNorthern AfricaNorthern EuropeNorwayOceaniaPakistanPanamaPeruPhilippinesPolandPortugalRomaniaRussiaSaudi ArabiaSenegalSerbiaSierra LeoneSingaporeSomaliaSouth AfricaSouth AmericaSouth Central AsiaSouth Eastern AsiaSouthern EuropeSpainSri LankaSt. Vincent and the GrenadinesSudanSwedenSwitzerlandSyriaTaiwanThailandTrinidad and TobagoTurkeyUgandaUkraineUruguayUzbekistanVenezuelaVietnamWest IndiesWestern AfricaWestern AsiaWestern EuropeYemenZaireZimbabweAzores
Seniors Poverty Over the Age of 75
Income
Poverty
Unemployment
Labor Participation
Family Structure
Vehicle Availability
Education Level
Disability

Seniors Poverty Over the Age of 75 Comparison

Immigrants from Scotland

Immigrants from Western Africa

Exceptional
Tragic
10.5%
SENIORS POVERTY OVER THE AGE OF 75
99.9/ 100
METRIC RATING
19th/ 347
METRIC RANK
13.9%
SENIORS POVERTY OVER THE AGE OF 75
0.1/ 100
METRIC RATING
257th/ 347
METRIC RANK

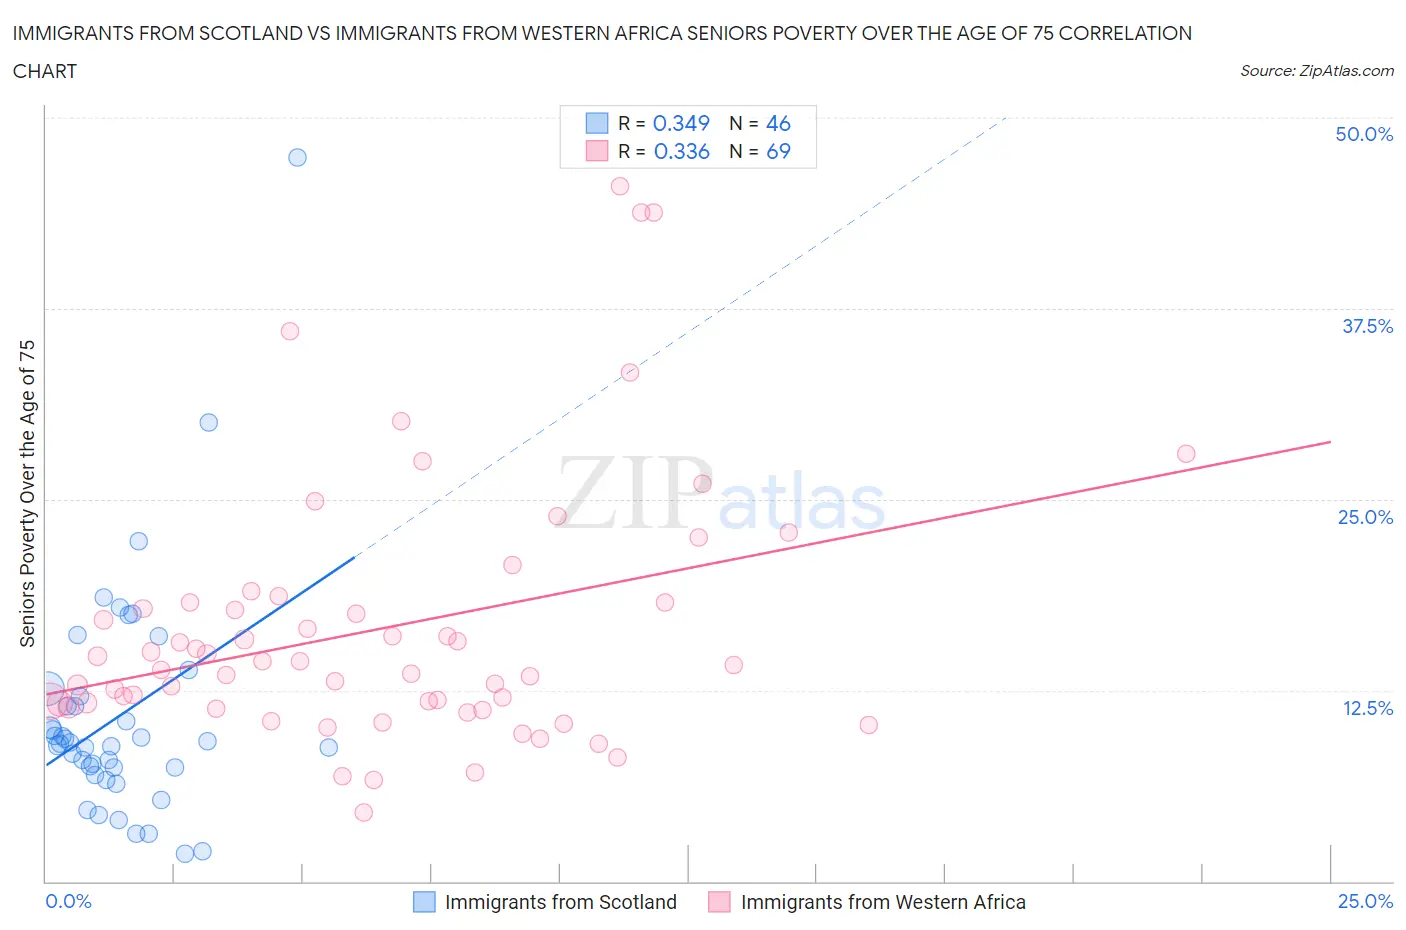
Immigrants from Scotland vs Immigrants from Western Africa Seniors Poverty Over the Age of 75 Correlation Chart

The statistical analysis conducted on geographies consisting of 195,397,076 people shows a mild positive correlation between the proportion of Immigrants from Scotland and poverty level among seniors over the age of 75 in the United States with a correlation coefficient (R) of 0.349 and weighted average of 10.5%. Similarly, the statistical analysis conducted on geographies consisting of 353,988,871 people shows a mild positive correlation between the proportion of Immigrants from Western Africa and poverty level among seniors over the age of 75 in the United States with a correlation coefficient (R) of 0.336 and weighted average of 13.9%, a difference of 32.0%.
Immigrants from Scotland vs Immigrants from Western Africa Seniors Poverty Over the Age of 75

Seniors Poverty Over the Age of 75 Correlation Summary

MeasurementImmigrants from ScotlandImmigrants from Western Africa
Minimum1.8%4.5%
Maximum47.4%45.5%
Range45.5%41.0%
Mean10.8%16.6%
Median9.0%14.1%
Interquartile 25% (IQ1)7.4%11.5%
Interquartile 75% (IQ3)12.1%18.2%
Interquartile Range (IQR)4.7%6.8%
Standard Deviation (Sample)7.7%8.6%
Standard Deviation (Population)7.6%8.5%

Similar Demographics by Seniors Poverty Over the Age of 75

Demographics Similar to Immigrants from Scotland by Seniors Poverty Over the Age of 75

In terms of seniors poverty over the age of 75, the demographic groups most similar to Immigrants from Scotland are Czech (10.5%, a difference of 0.020%), Slovak (10.5%, a difference of 0.040%), Welsh (10.5%, a difference of 0.040%), Slovene (10.6%, a difference of 0.060%), and Dutch (10.5%, a difference of 0.25%).
DemographicsRating | RankSeniors Poverty Over the Age of 75
Tongans
99.9
/100
|
#12
Exceptional
10.5%
Croatians
99.9
/100
|
#13
Exceptional
10.5%
Scottish
99.9
/100
|
#14
Exceptional
10.5%
Europeans
99.9
/100
|
#15
Exceptional
10.5%
Dutch
99.9
/100
|
#16
Exceptional
10.5%
Slovaks
99.9
/100
|
#17
Exceptional
10.5%
Welsh
99.9
/100
|
#18
Exceptional
10.5%
Immigrants | Scotland
99.9
/100
|
#19
Exceptional
10.5%
Czechs
99.9
/100
|
#20
Exceptional
10.5%
Slovenes
99.9
/100
|
#21
Exceptional
10.6%
Bhutanese
99.8
/100
|
#22
Exceptional
10.6%
Lithuanians
99.8
/100
|
#23
Exceptional
10.6%
Poles
99.8
/100
|
#24
Exceptional
10.6%
Menominee
99.8
/100
|
#25
Exceptional
10.6%
Bulgarians
99.8
/100
|
#26
Exceptional
10.7%

Demographics Similar to Immigrants from Western Africa by Seniors Poverty Over the Age of 75

In terms of seniors poverty over the age of 75, the demographic groups most similar to Immigrants from Western Africa are Immigrants from Panama (13.9%, a difference of 0.090%), Immigrants from Portugal (13.9%, a difference of 0.13%), Immigrants (13.9%, a difference of 0.20%), Ghanaian (14.0%, a difference of 0.30%), and Cajun (14.0%, a difference of 0.53%).
DemographicsRating | RankSeniors Poverty Over the Age of 75
Mexican American Indians
0.3
/100
|
#250
Tragic
13.6%
Immigrants | Peru
0.3
/100
|
#251
Tragic
13.7%
Immigrants | Argentina
0.3
/100
|
#252
Tragic
13.7%
Immigrants | Spain
0.2
/100
|
#253
Tragic
13.7%
Blackfeet
0.2
/100
|
#254
Tragic
13.7%
Immigrants | Belarus
0.2
/100
|
#255
Tragic
13.8%
Inupiat
0.1
/100
|
#256
Tragic
13.8%
Immigrants | Western Africa
0.1
/100
|
#257
Tragic
13.9%
Immigrants | Panama
0.1
/100
|
#258
Tragic
13.9%
Immigrants | Portugal
0.1
/100
|
#259
Tragic
13.9%
Immigrants | Immigrants
0.1
/100
|
#260
Tragic
13.9%
Ghanaians
0.1
/100
|
#261
Tragic
14.0%
Cajuns
0.1
/100
|
#262
Tragic
14.0%
Iroquois
0.1
/100
|
#263
Tragic
14.0%
South Americans
0.0
/100
|
#264
Tragic
14.1%