Yakama vs Hungarian Seniors Poverty Over the Age of 75
COMPARE
Yakama
Hungarian
Seniors Poverty Over the Age of 75
Seniors Poverty Over the Age of 75 Comparison
Yakama
Hungarians
18.3%
SENIORS POVERTY OVER THE AGE OF 75
0.0/ 100
METRIC RATING
337th/ 347
METRIC RANK
11.2%
SENIORS POVERTY OVER THE AGE OF 75
98.1/ 100
METRIC RATING
55th/ 347
METRIC RANK
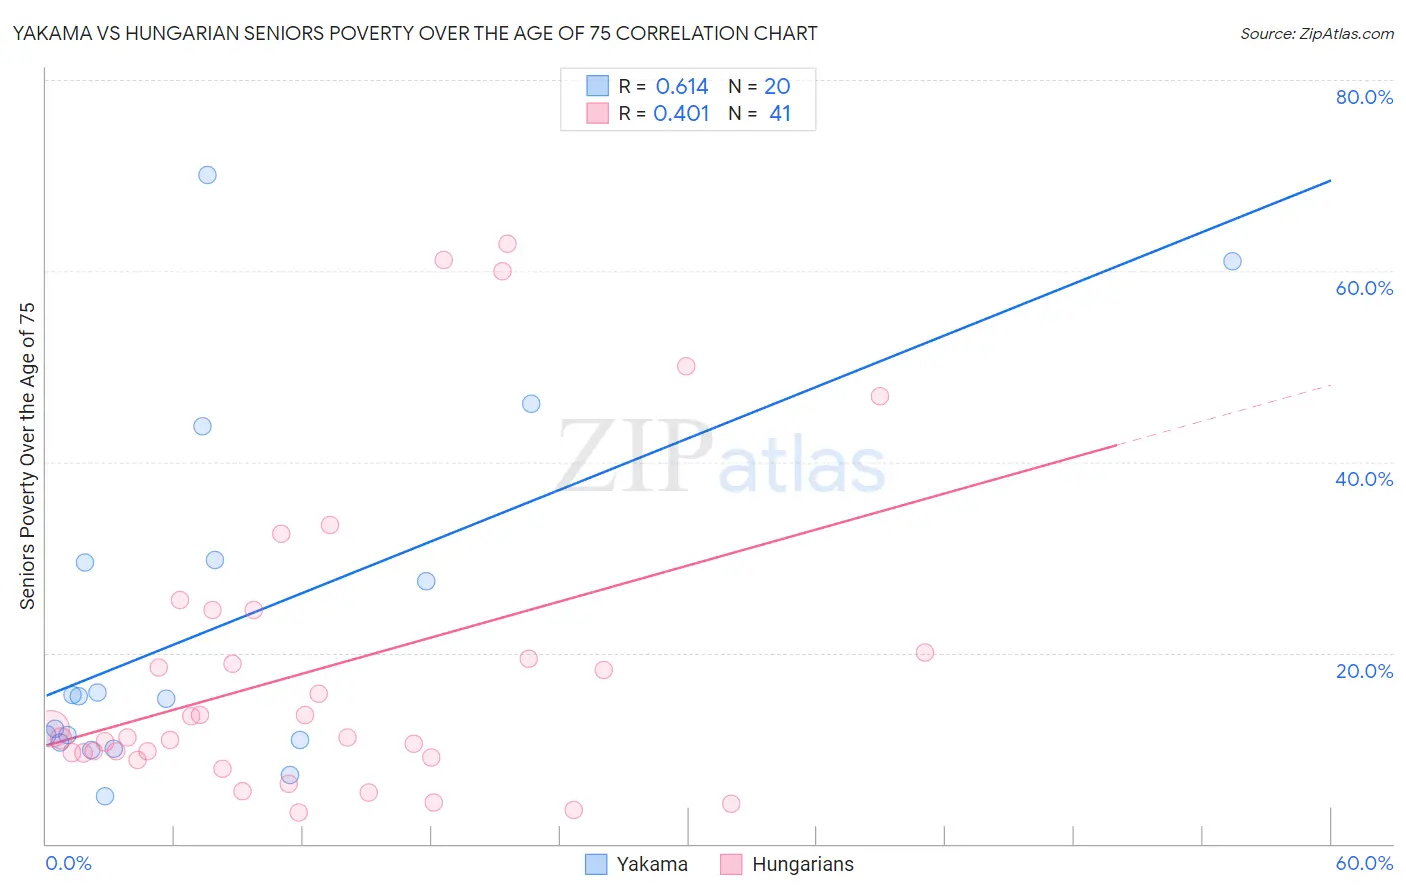
Yakama vs Hungarian Seniors Poverty Over the Age of 75 Correlation Chart
The statistical analysis conducted on geographies consisting of 19,834,385 people shows a significant positive correlation between the proportion of Yakama and poverty level among seniors over the age of 75 in the United States with a correlation coefficient (R) of 0.614 and weighted average of 18.3%. Similarly, the statistical analysis conducted on geographies consisting of 477,160,041 people shows a moderate positive correlation between the proportion of Hungarians and poverty level among seniors over the age of 75 in the United States with a correlation coefficient (R) of 0.401 and weighted average of 11.2%, a difference of 63.5%.
Seniors Poverty Over the Age of 75 Correlation Summary
| Measurement | Yakama | Hungarian |
| Minimum | 5.0% | 3.3% |
| Maximum | 70.0% | 62.8% |
| Range | 65.0% | 59.5% |
| Mean | 22.9% | 18.4% |
| Median | 15.3% | 11.2% |
| Interquartile 25% (IQ1) | 10.8% | 9.3% |
| Interquartile 75% (IQ3) | 29.6% | 22.2% |
| Interquartile Range (IQR) | 18.8% | 12.9% |
| Standard Deviation (Sample) | 18.6% | 16.1% |
| Standard Deviation (Population) | 18.1% | 15.9% |
Similar Demographics by Seniors Poverty Over the Age of 75
Demographics Similar to Yakama by Seniors Poverty Over the Age of 75
In terms of seniors poverty over the age of 75, the demographic groups most similar to Yakama are Immigrants from Caribbean (18.2%, a difference of 0.40%), Immigrants from Cabo Verde (18.5%, a difference of 0.97%), Cuban (18.0%, a difference of 2.1%), Immigrants from Grenada (17.8%, a difference of 2.6%), and Hopi (18.9%, a difference of 2.9%).
| Demographics | Rating | Rank | Seniors Poverty Over the Age of 75 |
| British West Indians | 0.0 /100 | #330 | Tragic 17.4% |
| Immigrants | Armenia | 0.0 /100 | #331 | Tragic 17.5% |
| Immigrants | St. Vincent and the Grenadines | 0.0 /100 | #332 | Tragic 17.5% |
| Immigrants | Nicaragua | 0.0 /100 | #333 | Tragic 17.6% |
| Immigrants | Grenada | 0.0 /100 | #334 | Tragic 17.8% |
| Cubans | 0.0 /100 | #335 | Tragic 18.0% |
| Immigrants | Caribbean | 0.0 /100 | #336 | Tragic 18.2% |
| Yakama | 0.0 /100 | #337 | Tragic 18.3% |
| Immigrants | Cabo Verde | 0.0 /100 | #338 | Tragic 18.5% |
| Hopi | 0.0 /100 | #339 | Tragic 18.9% |
| Tohono O'odham | 0.0 /100 | #340 | Tragic 19.1% |
| Navajo | 0.0 /100 | #341 | Tragic 19.4% |
| Dominicans | 0.0 /100 | #342 | Tragic 19.6% |
| Lumbee | 0.0 /100 | #343 | Tragic 19.7% |
| Immigrants | Cuba | 0.0 /100 | #344 | Tragic 19.9% |
Demographics Similar to Hungarians by Seniors Poverty Over the Age of 75
In terms of seniors poverty over the age of 75, the demographic groups most similar to Hungarians are Slavic (11.2%, a difference of 0.010%), Afghan (11.2%, a difference of 0.070%), Immigrants from Canada (11.2%, a difference of 0.24%), Yugoslavian (11.2%, a difference of 0.28%), and Immigrants from Netherlands (11.2%, a difference of 0.36%).
| Demographics | Rating | Rank | Seniors Poverty Over the Age of 75 |
| French | 98.7 /100 | #48 | Exceptional 11.1% |
| Samoans | 98.7 /100 | #49 | Exceptional 11.1% |
| Serbians | 98.6 /100 | #50 | Exceptional 11.1% |
| Immigrants | North Macedonia | 98.6 /100 | #51 | Exceptional 11.1% |
| Zimbabweans | 98.5 /100 | #52 | Exceptional 11.2% |
| Immigrants | England | 98.4 /100 | #53 | Exceptional 11.2% |
| Afghans | 98.2 /100 | #54 | Exceptional 11.2% |
| Hungarians | 98.1 /100 | #55 | Exceptional 11.2% |
| Slavs | 98.1 /100 | #56 | Exceptional 11.2% |
| Immigrants | Canada | 97.9 /100 | #57 | Exceptional 11.2% |
| Yugoslavians | 97.9 /100 | #58 | Exceptional 11.2% |
| Immigrants | Netherlands | 97.8 /100 | #59 | Exceptional 11.2% |
| Eastern Europeans | 97.7 /100 | #60 | Exceptional 11.3% |
| Canadians | 97.7 /100 | #61 | Exceptional 11.3% |
| Immigrants | North America | 97.6 /100 | #62 | Exceptional 11.3% |