Immigrants from Latvia vs Immigrants from Western Africa Seniors Poverty Over the Age of 75
COMPARE
Immigrants from Latvia
Immigrants from Western Africa
Seniors Poverty Over the Age of 75
Seniors Poverty Over the Age of 75 Comparison
Immigrants from Latvia
Immigrants from Western Africa
12.0%
SENIORS POVERTY OVER THE AGE OF 75
69.1/ 100
METRIC RATING
147th/ 347
METRIC RANK
13.9%
SENIORS POVERTY OVER THE AGE OF 75
0.1/ 100
METRIC RATING
257th/ 347
METRIC RANK
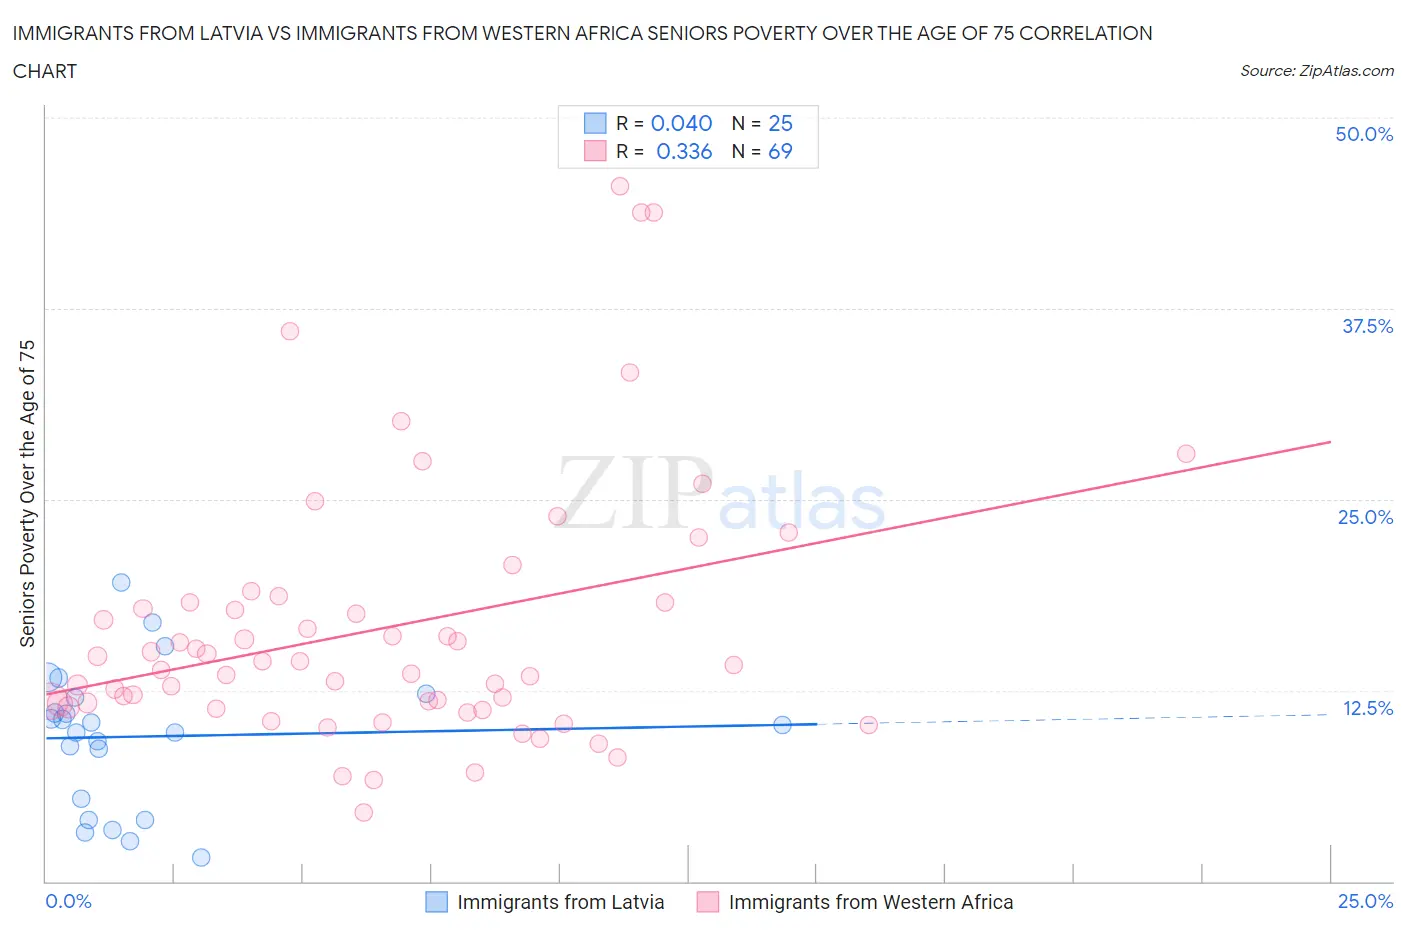
Immigrants from Latvia vs Immigrants from Western Africa Seniors Poverty Over the Age of 75 Correlation Chart
The statistical analysis conducted on geographies consisting of 113,276,104 people shows no correlation between the proportion of Immigrants from Latvia and poverty level among seniors over the age of 75 in the United States with a correlation coefficient (R) of 0.040 and weighted average of 12.0%. Similarly, the statistical analysis conducted on geographies consisting of 353,988,871 people shows a mild positive correlation between the proportion of Immigrants from Western Africa and poverty level among seniors over the age of 75 in the United States with a correlation coefficient (R) of 0.336 and weighted average of 13.9%, a difference of 16.1%.
Seniors Poverty Over the Age of 75 Correlation Summary
| Measurement | Immigrants from Latvia | Immigrants from Western Africa |
| Minimum | 1.5% | 4.5% |
| Maximum | 19.5% | 45.5% |
| Range | 18.0% | 41.0% |
| Mean | 9.5% | 16.6% |
| Median | 10.2% | 14.1% |
| Interquartile 25% (IQ1) | 4.7% | 11.5% |
| Interquartile 75% (IQ3) | 12.1% | 18.2% |
| Interquartile Range (IQR) | 7.4% | 6.8% |
| Standard Deviation (Sample) | 4.6% | 8.6% |
| Standard Deviation (Population) | 4.5% | 8.5% |
Similar Demographics by Seniors Poverty Over the Age of 75
Demographics Similar to Immigrants from Latvia by Seniors Poverty Over the Age of 75
In terms of seniors poverty over the age of 75, the demographic groups most similar to Immigrants from Latvia are Bangladeshi (12.0%, a difference of 0.12%), Immigrants from Zaire (12.0%, a difference of 0.15%), Asian (12.0%, a difference of 0.16%), Hmong (12.0%, a difference of 0.17%), and Immigrants from Belgium (12.0%, a difference of 0.17%).
| Demographics | Rating | Rank | Seniors Poverty Over the Age of 75 |
| Immigrants | Pakistan | 71.9 /100 | #140 | Good 12.0% |
| Immigrants | Cameroon | 71.7 /100 | #141 | Good 12.0% |
| Immigrants | Laos | 71.5 /100 | #142 | Good 12.0% |
| Americans | 71.0 /100 | #143 | Good 12.0% |
| Hmong | 70.8 /100 | #144 | Good 12.0% |
| Immigrants | Belgium | 70.8 /100 | #145 | Good 12.0% |
| Bangladeshis | 70.4 /100 | #146 | Good 12.0% |
| Immigrants | Latvia | 69.1 /100 | #147 | Good 12.0% |
| Immigrants | Zaire | 67.6 /100 | #148 | Good 12.0% |
| Asians | 67.4 /100 | #149 | Good 12.0% |
| Cypriots | 67.3 /100 | #150 | Good 12.0% |
| Cherokee | 65.8 /100 | #151 | Good 12.0% |
| Immigrants | Korea | 65.5 /100 | #152 | Good 12.0% |
| Immigrants | Turkey | 64.7 /100 | #153 | Good 12.0% |
| Cambodians | 64.0 /100 | #154 | Good 12.0% |
Demographics Similar to Immigrants from Western Africa by Seniors Poverty Over the Age of 75
In terms of seniors poverty over the age of 75, the demographic groups most similar to Immigrants from Western Africa are Immigrants from Panama (13.9%, a difference of 0.090%), Immigrants from Portugal (13.9%, a difference of 0.13%), Immigrants (13.9%, a difference of 0.20%), Ghanaian (14.0%, a difference of 0.30%), and Cajun (14.0%, a difference of 0.53%).
| Demographics | Rating | Rank | Seniors Poverty Over the Age of 75 |
| Mexican American Indians | 0.3 /100 | #250 | Tragic 13.6% |
| Immigrants | Peru | 0.3 /100 | #251 | Tragic 13.7% |
| Immigrants | Argentina | 0.3 /100 | #252 | Tragic 13.7% |
| Immigrants | Spain | 0.2 /100 | #253 | Tragic 13.7% |
| Blackfeet | 0.2 /100 | #254 | Tragic 13.7% |
| Immigrants | Belarus | 0.2 /100 | #255 | Tragic 13.8% |
| Inupiat | 0.1 /100 | #256 | Tragic 13.8% |
| Immigrants | Western Africa | 0.1 /100 | #257 | Tragic 13.9% |
| Immigrants | Panama | 0.1 /100 | #258 | Tragic 13.9% |
| Immigrants | Portugal | 0.1 /100 | #259 | Tragic 13.9% |
| Immigrants | Immigrants | 0.1 /100 | #260 | Tragic 13.9% |
| Ghanaians | 0.1 /100 | #261 | Tragic 14.0% |
| Cajuns | 0.1 /100 | #262 | Tragic 14.0% |
| Iroquois | 0.1 /100 | #263 | Tragic 14.0% |
| South Americans | 0.0 /100 | #264 | Tragic 14.1% |