Yakama vs Immigrants from Western Africa Single Mother Households
COMPARE
Yakama
Immigrants from Western Africa
Single Mother Households
Single Mother Households Comparison
Yakama
Immigrants from Western Africa
8.4%
SINGLE MOTHER HOUSEHOLDS
0.0/ 100
METRIC RATING
328th/ 347
METRIC RANK
8.2%
SINGLE MOTHER HOUSEHOLDS
0.0/ 100
METRIC RATING
315th/ 347
METRIC RANK
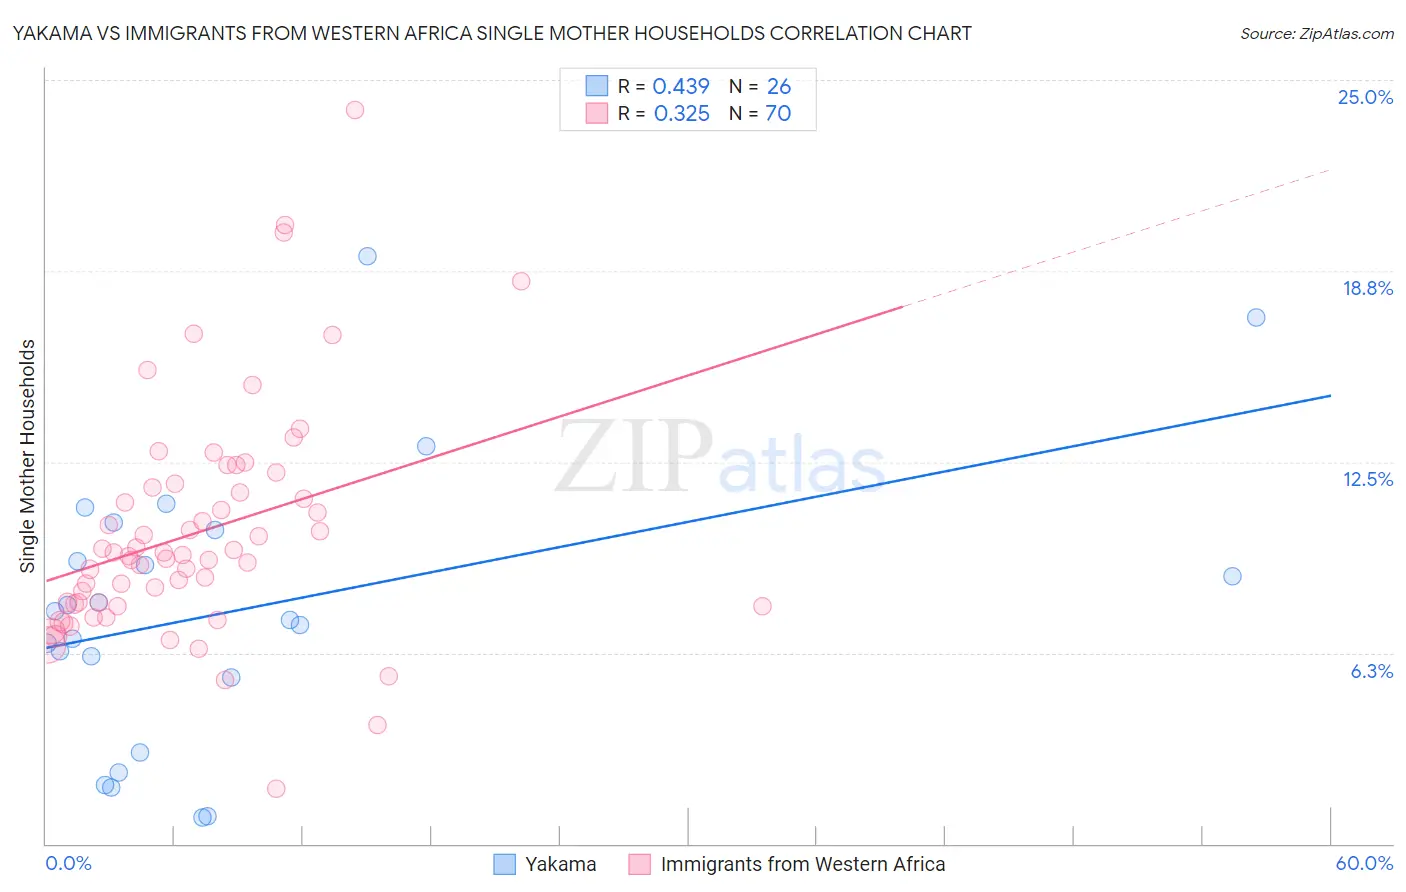
Yakama vs Immigrants from Western Africa Single Mother Households Correlation Chart
The statistical analysis conducted on geographies consisting of 19,909,884 people shows a moderate positive correlation between the proportion of Yakama and percentage of single mother households in the United States with a correlation coefficient (R) of 0.439 and weighted average of 8.4%. Similarly, the statistical analysis conducted on geographies consisting of 357,161,566 people shows a mild positive correlation between the proportion of Immigrants from Western Africa and percentage of single mother households in the United States with a correlation coefficient (R) of 0.325 and weighted average of 8.2%, a difference of 3.0%.
Single Mother Households Correlation Summary
| Measurement | Yakama | Immigrants from Western Africa |
| Minimum | 0.86% | 1.8% |
| Maximum | 19.2% | 24.0% |
| Range | 18.4% | 22.2% |
| Mean | 7.7% | 10.2% |
| Median | 7.5% | 9.4% |
| Interquartile 25% (IQ1) | 5.4% | 7.9% |
| Interquartile 75% (IQ3) | 10.3% | 11.7% |
| Interquartile Range (IQR) | 4.8% | 3.8% |
| Standard Deviation (Sample) | 4.6% | 3.8% |
| Standard Deviation (Population) | 4.5% | 3.7% |
Demographics Similar to Yakama and Immigrants from Western Africa by Single Mother Households
In terms of single mother households, the demographic groups most similar to Yakama are Immigrants from Haiti (8.4%, a difference of 0.18%), British West Indian (8.4%, a difference of 0.32%), Immigrants from Caribbean (8.4%, a difference of 0.45%), Immigrants from Jamaica (8.4%, a difference of 0.63%), and Hopi (8.5%, a difference of 0.75%). Similarly, the demographic groups most similar to Immigrants from Western Africa are Immigrants from Mexico (8.2%, a difference of 0.030%), Immigrants from Grenada (8.2%, a difference of 0.15%), African (8.2%, a difference of 0.15%), Immigrants from Honduras (8.2%, a difference of 0.28%), and Bangladeshi (8.1%, a difference of 0.31%).
| Demographics | Rating | Rank | Single Mother Households |
| Immigrants | Congo | 0.0 /100 | #311 | Tragic 8.1% |
| Bangladeshis | 0.0 /100 | #312 | Tragic 8.1% |
| Immigrants | Grenada | 0.0 /100 | #313 | Tragic 8.2% |
| Immigrants | Mexico | 0.0 /100 | #314 | Tragic 8.2% |
| Immigrants | Western Africa | 0.0 /100 | #315 | Tragic 8.2% |
| Africans | 0.0 /100 | #316 | Tragic 8.2% |
| Immigrants | Honduras | 0.0 /100 | #317 | Tragic 8.2% |
| Senegalese | 0.0 /100 | #318 | Tragic 8.2% |
| Jamaicans | 0.0 /100 | #319 | Tragic 8.2% |
| Bahamians | 0.0 /100 | #320 | Tragic 8.3% |
| Immigrants | Senegal | 0.0 /100 | #321 | Tragic 8.3% |
| Pima | 0.0 /100 | #322 | Tragic 8.3% |
| Haitians | 0.0 /100 | #323 | Tragic 8.3% |
| Immigrants | Jamaica | 0.0 /100 | #324 | Tragic 8.4% |
| Immigrants | Caribbean | 0.0 /100 | #325 | Tragic 8.4% |
| British West Indians | 0.0 /100 | #326 | Tragic 8.4% |
| Immigrants | Haiti | 0.0 /100 | #327 | Tragic 8.4% |
| Yakama | 0.0 /100 | #328 | Tragic 8.4% |
| Hopi | 0.0 /100 | #329 | Tragic 8.5% |
| Inupiat | 0.0 /100 | #330 | Tragic 8.5% |
| Sioux | 0.0 /100 | #331 | Tragic 8.5% |