Immigrants from El Salvador vs Immigrants from Moldova Family Poverty
COMPARE
Immigrants from El Salvador
Immigrants from Moldova
Family Poverty
Family Poverty Comparison
Immigrants from El Salvador
Immigrants from Moldova
11.0%
FAMILY POVERTY
0.1/ 100
METRIC RATING
266th/ 347
METRIC RANK
7.7%
FAMILY POVERTY
98.8/ 100
METRIC RATING
51st/ 347
METRIC RANK
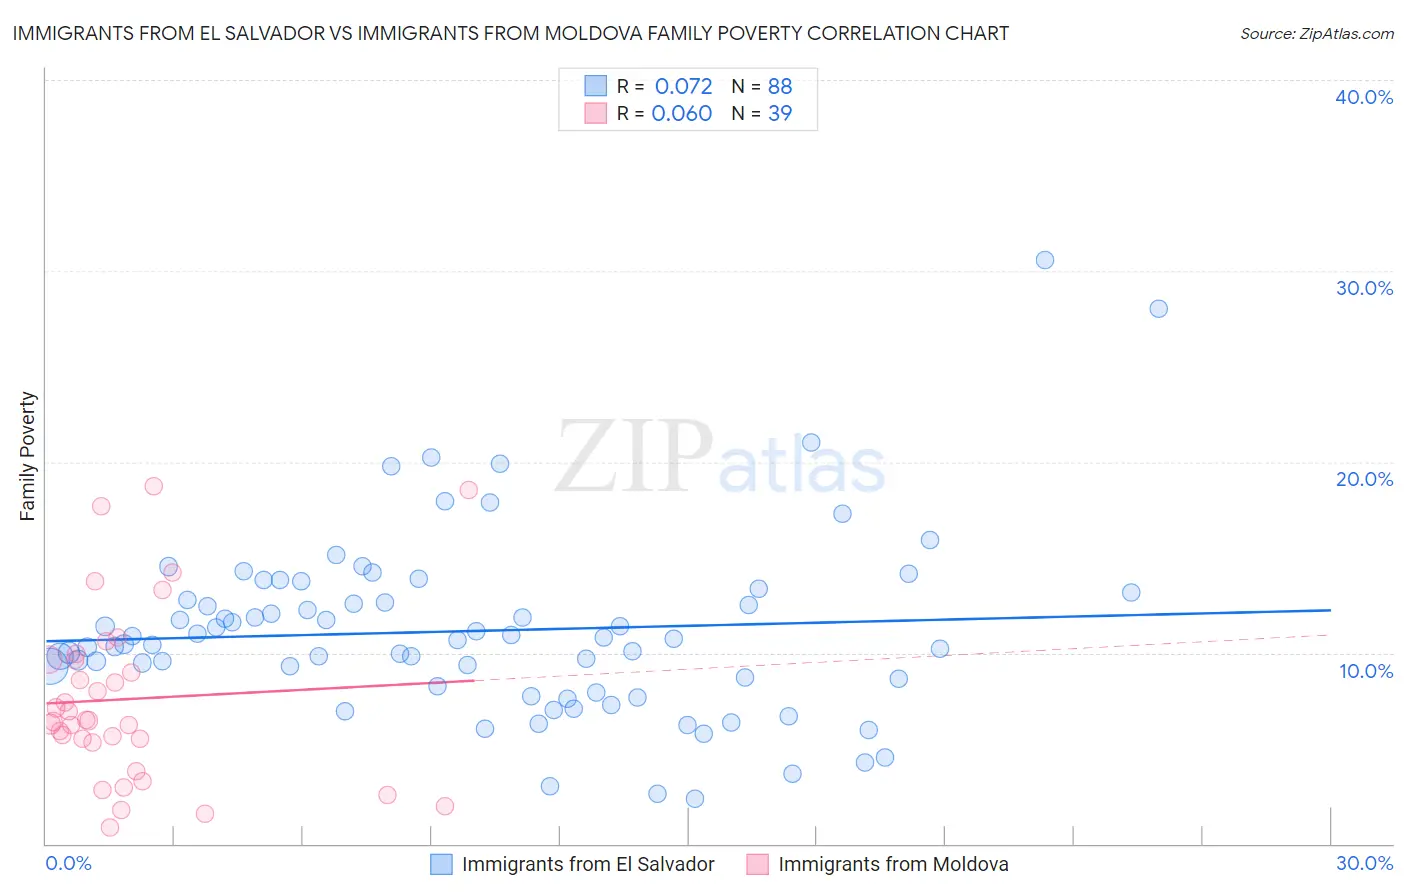
Immigrants from El Salvador vs Immigrants from Moldova Family Poverty Correlation Chart
The statistical analysis conducted on geographies consisting of 357,239,196 people shows a slight positive correlation between the proportion of Immigrants from El Salvador and poverty level among families in the United States with a correlation coefficient (R) of 0.072 and weighted average of 11.0%. Similarly, the statistical analysis conducted on geographies consisting of 124,316,177 people shows a slight positive correlation between the proportion of Immigrants from Moldova and poverty level among families in the United States with a correlation coefficient (R) of 0.060 and weighted average of 7.7%, a difference of 43.5%.
Family Poverty Correlation Summary
| Measurement | Immigrants from El Salvador | Immigrants from Moldova |
| Minimum | 2.4% | 0.83% |
| Maximum | 30.5% | 18.7% |
| Range | 28.2% | 17.9% |
| Mean | 11.1% | 7.6% |
| Median | 10.7% | 6.4% |
| Interquartile 25% (IQ1) | 8.4% | 5.3% |
| Interquartile 75% (IQ3) | 13.0% | 9.6% |
| Interquartile Range (IQR) | 4.5% | 4.3% |
| Standard Deviation (Sample) | 4.8% | 4.5% |
| Standard Deviation (Population) | 4.7% | 4.5% |
Similar Demographics by Family Poverty
Demographics Similar to Immigrants from El Salvador by Family Poverty
In terms of family poverty, the demographic groups most similar to Immigrants from El Salvador are Comanche (11.0%, a difference of 0.010%), Jamaican (11.1%, a difference of 0.12%), Immigrants from Ecuador (11.1%, a difference of 0.60%), Immigrants from Nicaragua (11.1%, a difference of 0.60%), and Immigrants from Bahamas (11.1%, a difference of 0.85%).
| Demographics | Rating | Rank | Family Poverty |
| Mexican American Indians | 0.2 /100 | #259 | Tragic 10.9% |
| Bangladeshis | 0.2 /100 | #260 | Tragic 10.9% |
| Shoshone | 0.2 /100 | #261 | Tragic 10.9% |
| Spanish American Indians | 0.2 /100 | #262 | Tragic 10.9% |
| Cape Verdeans | 0.1 /100 | #263 | Tragic 10.9% |
| Trinidadians and Tobagonians | 0.1 /100 | #264 | Tragic 10.9% |
| Immigrants | Trinidad and Tobago | 0.1 /100 | #265 | Tragic 10.9% |
| Immigrants | El Salvador | 0.1 /100 | #266 | Tragic 11.0% |
| Comanche | 0.1 /100 | #267 | Tragic 11.0% |
| Jamaicans | 0.1 /100 | #268 | Tragic 11.1% |
| Immigrants | Ecuador | 0.1 /100 | #269 | Tragic 11.1% |
| Immigrants | Nicaragua | 0.1 /100 | #270 | Tragic 11.1% |
| Immigrants | Bahamas | 0.1 /100 | #271 | Tragic 11.1% |
| Immigrants | Jamaica | 0.1 /100 | #272 | Tragic 11.2% |
| Somalis | 0.1 /100 | #273 | Tragic 11.2% |
Demographics Similar to Immigrants from Moldova by Family Poverty
In terms of family poverty, the demographic groups most similar to Immigrants from Moldova are Immigrants from North Macedonia (7.7%, a difference of 0.15%), Indian (Asian) (7.7%, a difference of 0.16%), Immigrants from Bolivia (7.7%, a difference of 0.18%), Swiss (7.7%, a difference of 0.22%), and Immigrants from Sweden (7.7%, a difference of 0.23%).
| Demographics | Rating | Rank | Family Poverty |
| Germans | 99.0 /100 | #44 | Exceptional 7.7% |
| Okinawans | 98.9 /100 | #45 | Exceptional 7.7% |
| Tongans | 98.9 /100 | #46 | Exceptional 7.7% |
| Immigrants | Czechoslovakia | 98.9 /100 | #47 | Exceptional 7.7% |
| Immigrants | Sri Lanka | 98.9 /100 | #48 | Exceptional 7.7% |
| Immigrants | Bolivia | 98.9 /100 | #49 | Exceptional 7.7% |
| Immigrants | North Macedonia | 98.9 /100 | #50 | Exceptional 7.7% |
| Immigrants | Moldova | 98.8 /100 | #51 | Exceptional 7.7% |
| Indians (Asian) | 98.8 /100 | #52 | Exceptional 7.7% |
| Swiss | 98.8 /100 | #53 | Exceptional 7.7% |
| Immigrants | Sweden | 98.8 /100 | #54 | Exceptional 7.7% |
| Immigrants | Eastern Asia | 98.7 /100 | #55 | Exceptional 7.7% |
| Immigrants | Serbia | 98.7 /100 | #56 | Exceptional 7.7% |
| Asians | 98.7 /100 | #57 | Exceptional 7.7% |
| Finns | 98.7 /100 | #58 | Exceptional 7.7% |