Arapaho vs Immigrants from Portugal Child Poverty Under the Age of 16
COMPARE
Arapaho
Immigrants from Portugal
Child Poverty Under the Age of 16
Child Poverty Under the Age of 16 Comparison
Arapaho
Immigrants from Portugal
20.8%
CHILD POVERTY UNDER THE AGE OF 16
0.0/ 100
METRIC RATING
298th/ 347
METRIC RANK
16.6%
CHILD POVERTY UNDER THE AGE OF 16
30.0/ 100
METRIC RATING
189th/ 347
METRIC RANK
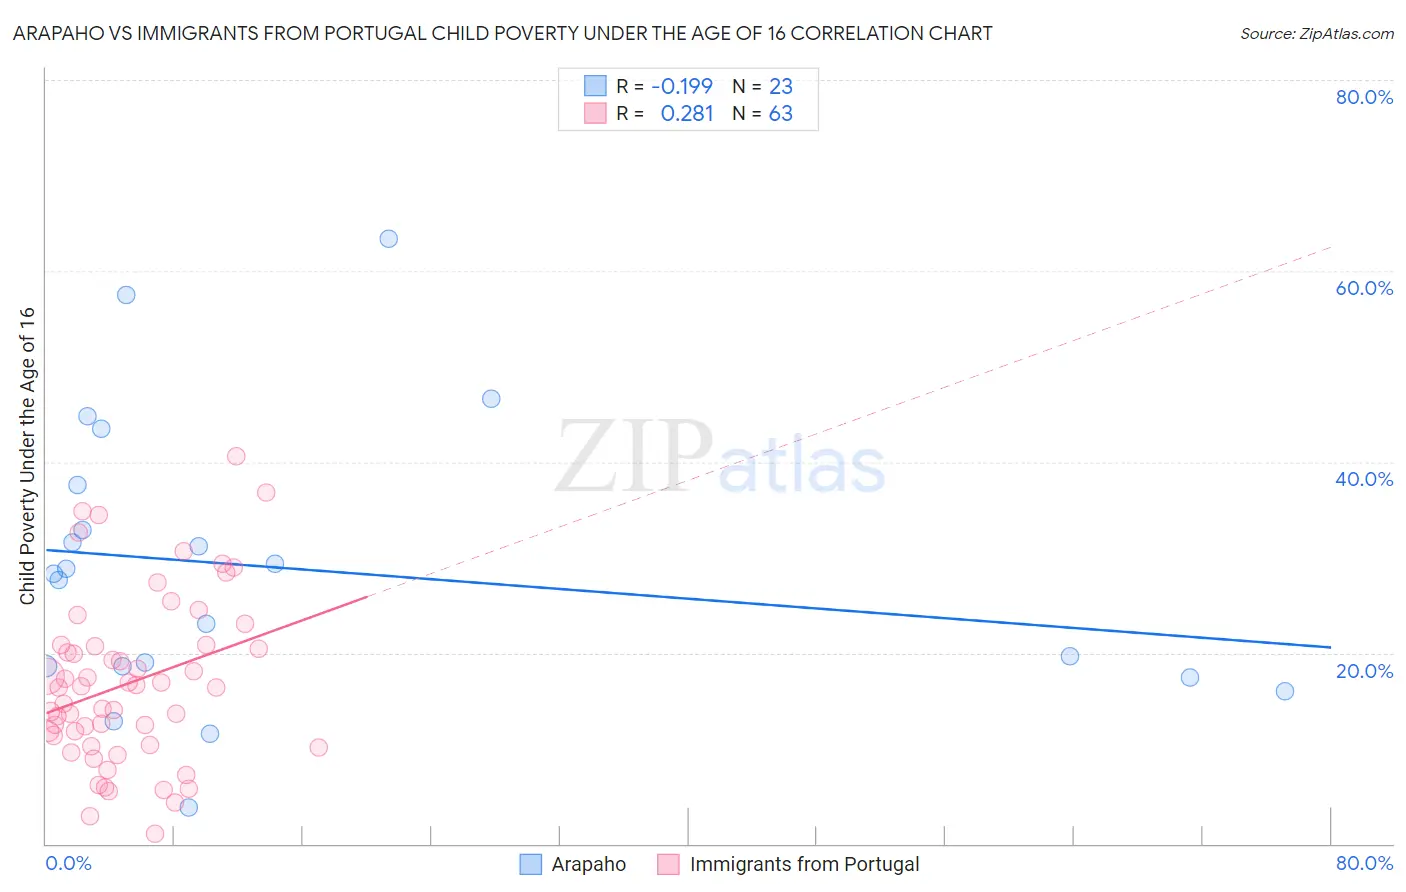
Arapaho vs Immigrants from Portugal Child Poverty Under the Age of 16 Correlation Chart
The statistical analysis conducted on geographies consisting of 29,725,461 people shows a poor negative correlation between the proportion of Arapaho and poverty level among children under the age of 16 in the United States with a correlation coefficient (R) of -0.199 and weighted average of 20.8%. Similarly, the statistical analysis conducted on geographies consisting of 173,575,253 people shows a weak positive correlation between the proportion of Immigrants from Portugal and poverty level among children under the age of 16 in the United States with a correlation coefficient (R) of 0.281 and weighted average of 16.6%, a difference of 25.1%.
Child Poverty Under the Age of 16 Correlation Summary
| Measurement | Arapaho | Immigrants from Portugal |
| Minimum | 3.7% | 1.1% |
| Maximum | 63.3% | 40.5% |
| Range | 59.6% | 39.4% |
| Mean | 28.8% | 16.9% |
| Median | 28.3% | 16.4% |
| Interquartile 25% (IQ1) | 18.5% | 10.3% |
| Interquartile 75% (IQ3) | 37.6% | 20.8% |
| Interquartile Range (IQR) | 19.1% | 10.5% |
| Standard Deviation (Sample) | 14.8% | 8.8% |
| Standard Deviation (Population) | 14.5% | 8.7% |
Similar Demographics by Child Poverty Under the Age of 16
Demographics Similar to Arapaho by Child Poverty Under the Age of 16
In terms of child poverty under the age of 16, the demographic groups most similar to Arapaho are Hispanic or Latino (20.8%, a difference of 0.0%), Immigrants from Caribbean (20.8%, a difference of 0.13%), Immigrants from Haiti (20.9%, a difference of 0.30%), Mexican (20.7%, a difference of 0.51%), and Haitian (20.7%, a difference of 0.65%).
| Demographics | Rating | Rank | Child Poverty Under the Age of 16 |
| Chippewa | 0.0 /100 | #291 | Tragic 20.5% |
| Immigrants | Latin America | 0.0 /100 | #292 | Tragic 20.5% |
| Immigrants | Senegal | 0.0 /100 | #293 | Tragic 20.6% |
| Haitians | 0.0 /100 | #294 | Tragic 20.7% |
| Mexicans | 0.0 /100 | #295 | Tragic 20.7% |
| Immigrants | Caribbean | 0.0 /100 | #296 | Tragic 20.8% |
| Hispanics or Latinos | 0.0 /100 | #297 | Tragic 20.8% |
| Arapaho | 0.0 /100 | #298 | Tragic 20.8% |
| Immigrants | Haiti | 0.0 /100 | #299 | Tragic 20.9% |
| Indonesians | 0.0 /100 | #300 | Tragic 21.0% |
| Immigrants | Grenada | 0.0 /100 | #301 | Tragic 21.0% |
| Immigrants | Bahamas | 0.0 /100 | #302 | Tragic 21.0% |
| Choctaw | 0.0 /100 | #303 | Tragic 21.0% |
| Somalis | 0.0 /100 | #304 | Tragic 21.0% |
| Seminole | 0.0 /100 | #305 | Tragic 21.1% |
Demographics Similar to Immigrants from Portugal by Child Poverty Under the Age of 16
In terms of child poverty under the age of 16, the demographic groups most similar to Immigrants from Portugal are Immigrants from Costa Rica (16.6%, a difference of 0.060%), Immigrants from Morocco (16.6%, a difference of 0.17%), Arab (16.6%, a difference of 0.19%), Immigrants from Iraq (16.7%, a difference of 0.25%), and Kenyan (16.5%, a difference of 0.55%).
| Demographics | Rating | Rank | Child Poverty Under the Age of 16 |
| Hawaiians | 38.2 /100 | #182 | Fair 16.4% |
| Celtics | 38.2 /100 | #183 | Fair 16.4% |
| Immigrants | Western Asia | 38.0 /100 | #184 | Fair 16.4% |
| Immigrants | Bosnia and Herzegovina | 37.4 /100 | #185 | Fair 16.5% |
| Kenyans | 34.1 /100 | #186 | Fair 16.5% |
| Arabs | 31.4 /100 | #187 | Fair 16.6% |
| Immigrants | Morocco | 31.2 /100 | #188 | Fair 16.6% |
| Immigrants | Portugal | 30.0 /100 | #189 | Fair 16.6% |
| Immigrants | Costa Rica | 29.6 /100 | #190 | Fair 16.6% |
| Immigrants | Iraq | 28.3 /100 | #191 | Fair 16.7% |
| Spanish | 24.5 /100 | #192 | Fair 16.7% |
| Spaniards | 23.2 /100 | #193 | Fair 16.8% |
| Immigrants | Uruguay | 23.1 /100 | #194 | Fair 16.8% |
| Immigrants | Uganda | 22.5 /100 | #195 | Fair 16.8% |
| Immigrants | Lebanon | 22.0 /100 | #196 | Fair 16.8% |