West Indian vs Spanish Female Poverty Among 18-24 Year Olds
COMPARE
West Indian
Spanish
Female Poverty Among 18-24 Year Olds
Female Poverty Among 18-24 Year Olds Comparison
West Indians
Spanish
21.1%
FEMALE POVERTY AMONG 18-24 YEAR OLDS
1.9/ 100
METRIC RATING
251st/ 347
METRIC RANK
20.6%
FEMALE POVERTY AMONG 18-24 YEAR OLDS
10.4/ 100
METRIC RATING
215th/ 347
METRIC RANK
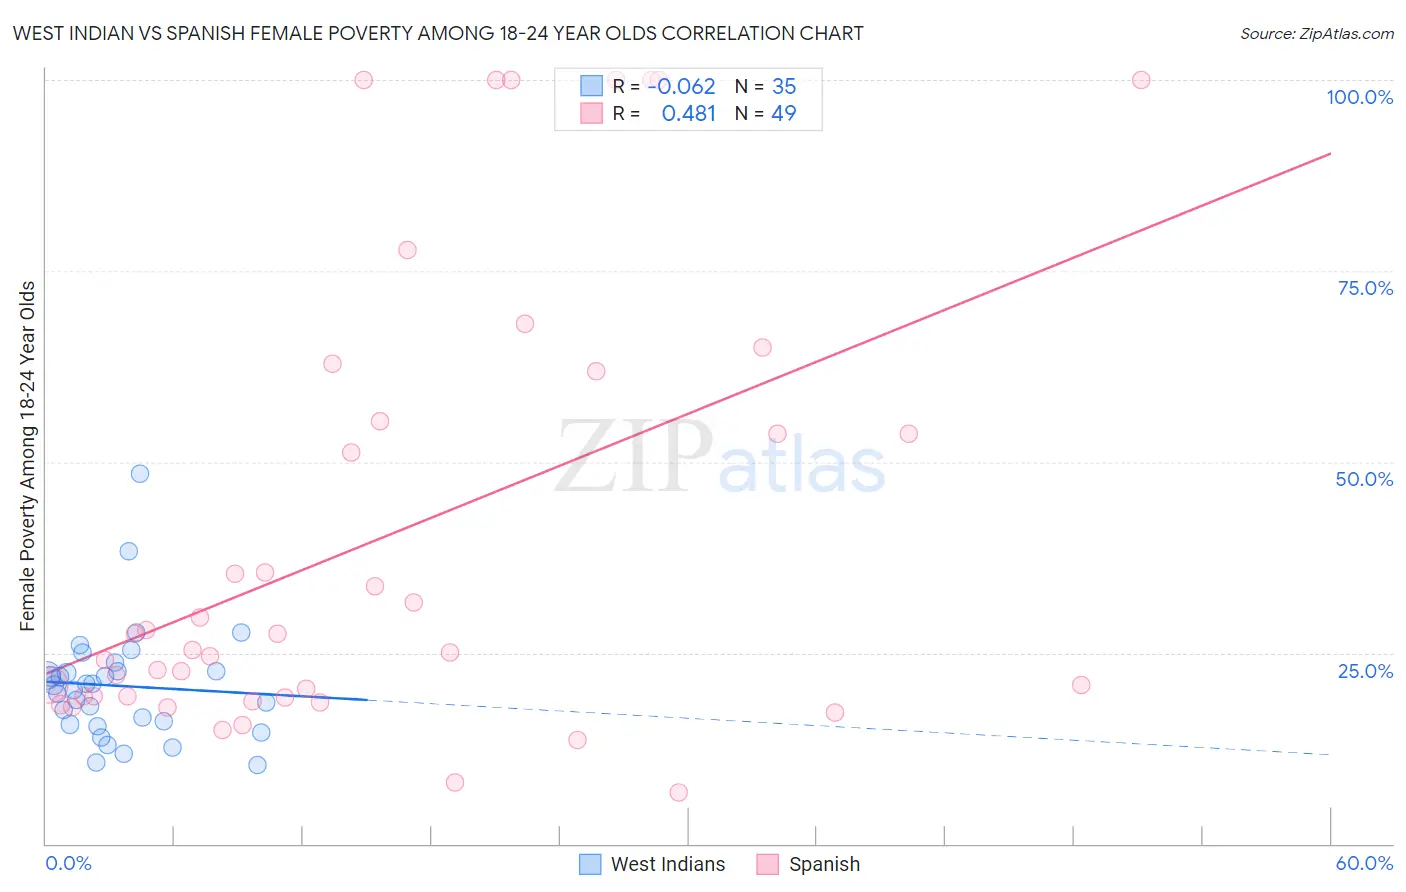
West Indian vs Spanish Female Poverty Among 18-24 Year Olds Correlation Chart
The statistical analysis conducted on geographies consisting of 250,472,705 people shows a slight negative correlation between the proportion of West Indians and poverty level among females between the ages 18 and 24 in the United States with a correlation coefficient (R) of -0.062 and weighted average of 21.1%. Similarly, the statistical analysis conducted on geographies consisting of 411,092,173 people shows a moderate positive correlation between the proportion of Spanish and poverty level among females between the ages 18 and 24 in the United States with a correlation coefficient (R) of 0.481 and weighted average of 20.6%, a difference of 2.1%.
Female Poverty Among 18-24 Year Olds Correlation Summary
| Measurement | West Indian | Spanish |
| Minimum | 10.4% | 6.7% |
| Maximum | 48.5% | 100.0% |
| Range | 38.1% | 93.3% |
| Mean | 20.7% | 40.2% |
| Median | 20.8% | 25.3% |
| Interquartile 25% (IQ1) | 15.6% | 19.2% |
| Interquartile 75% (IQ3) | 22.6% | 58.6% |
| Interquartile Range (IQR) | 7.0% | 39.4% |
| Standard Deviation (Sample) | 7.5% | 29.6% |
| Standard Deviation (Population) | 7.4% | 29.3% |
Similar Demographics by Female Poverty Among 18-24 Year Olds
Demographics Similar to West Indians by Female Poverty Among 18-24 Year Olds
In terms of female poverty among 18-24 year olds, the demographic groups most similar to West Indians are South African (21.1%, a difference of 0.18%), Immigrants from West Indies (21.0%, a difference of 0.20%), Delaware (21.1%, a difference of 0.23%), Carpatho Rusyn (21.0%, a difference of 0.33%), and Immigrants from Kenya (21.0%, a difference of 0.35%).
| Demographics | Rating | Rank | Female Poverty Among 18-24 Year Olds |
| Immigrants | Thailand | 3.4 /100 | #244 | Tragic 20.9% |
| Aleuts | 3.3 /100 | #245 | Tragic 20.9% |
| Immigrants | Australia | 3.1 /100 | #246 | Tragic 20.9% |
| Immigrants | Africa | 3.0 /100 | #247 | Tragic 21.0% |
| Immigrants | Kenya | 2.5 /100 | #248 | Tragic 21.0% |
| Carpatho Rusyns | 2.5 /100 | #249 | Tragic 21.0% |
| Immigrants | West Indies | 2.2 /100 | #250 | Tragic 21.0% |
| West Indians | 1.9 /100 | #251 | Tragic 21.1% |
| South Africans | 1.6 /100 | #252 | Tragic 21.1% |
| Delaware | 1.6 /100 | #253 | Tragic 21.1% |
| British West Indians | 1.2 /100 | #254 | Tragic 21.2% |
| Immigrants | Grenada | 1.2 /100 | #255 | Tragic 21.2% |
| Tsimshian | 1.0 /100 | #256 | Tragic 21.2% |
| Taiwanese | 1.0 /100 | #257 | Tragic 21.2% |
| Vietnamese | 0.6 /100 | #258 | Tragic 21.4% |
Demographics Similar to Spanish by Female Poverty Among 18-24 Year Olds
In terms of female poverty among 18-24 year olds, the demographic groups most similar to Spanish are Immigrants from Western Africa (20.6%, a difference of 0.020%), Immigrants from South Africa (20.6%, a difference of 0.040%), Immigrants from Laos (20.6%, a difference of 0.090%), Immigrants from Nepal (20.7%, a difference of 0.10%), and Immigrants from Micronesia (20.7%, a difference of 0.11%).
| Demographics | Rating | Rank | Female Poverty Among 18-24 Year Olds |
| Dutch | 15.9 /100 | #208 | Poor 20.5% |
| Arabs | 15.5 /100 | #209 | Poor 20.5% |
| Immigrants | Ghana | 14.3 /100 | #210 | Poor 20.5% |
| Immigrants | Western Europe | 13.5 /100 | #211 | Poor 20.6% |
| Liberians | 11.6 /100 | #212 | Poor 20.6% |
| Northern Europeans | 11.6 /100 | #213 | Poor 20.6% |
| Immigrants | South Africa | 10.7 /100 | #214 | Poor 20.6% |
| Spanish | 10.4 /100 | #215 | Poor 20.6% |
| Immigrants | Western Africa | 10.2 /100 | #216 | Poor 20.6% |
| Immigrants | Laos | 9.7 /100 | #217 | Tragic 20.6% |
| Immigrants | Nepal | 9.6 /100 | #218 | Tragic 20.7% |
| Immigrants | Micronesia | 9.6 /100 | #219 | Tragic 20.7% |
| British | 9.4 /100 | #220 | Tragic 20.7% |
| Barbadians | 9.0 /100 | #221 | Tragic 20.7% |
| Guatemalans | 8.1 /100 | #222 | Tragic 20.7% |