West Indian vs Jordanian Seniors Poverty Over the Age of 75
COMPARE
West Indian
Jordanian
Seniors Poverty Over the Age of 75
Seniors Poverty Over the Age of 75 Comparison
West Indians
Jordanians
15.7%
SENIORS POVERTY OVER THE AGE OF 75
0.0/ 100
METRIC RATING
302nd/ 347
METRIC RANK
11.6%
SENIORS POVERTY OVER THE AGE OF 75
90.8/ 100
METRIC RATING
101st/ 347
METRIC RANK
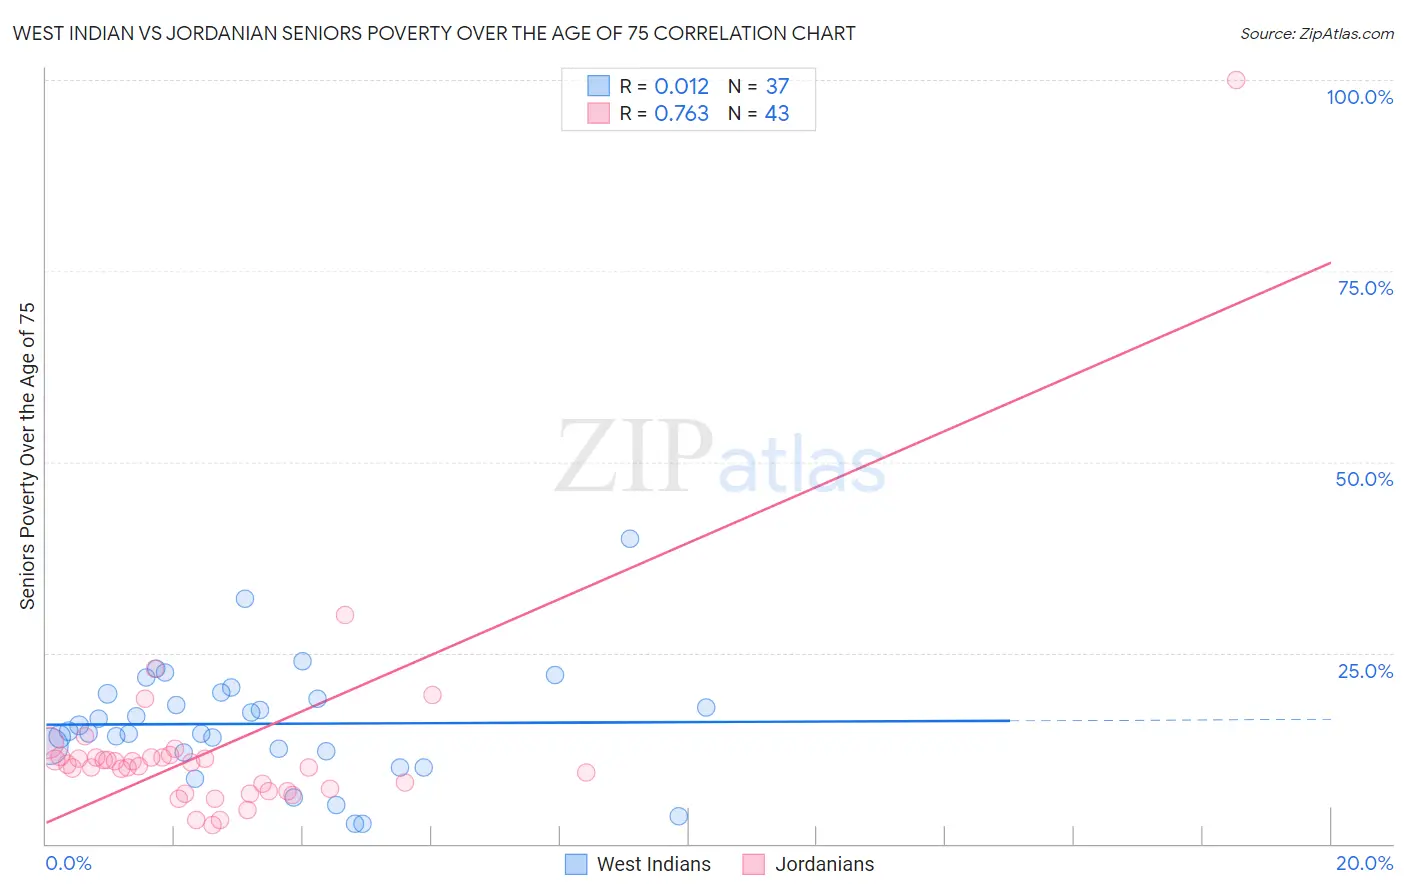
West Indian vs Jordanian Seniors Poverty Over the Age of 75 Correlation Chart
The statistical analysis conducted on geographies consisting of 252,374,220 people shows no correlation between the proportion of West Indians and poverty level among seniors over the age of 75 in the United States with a correlation coefficient (R) of 0.012 and weighted average of 15.7%. Similarly, the statistical analysis conducted on geographies consisting of 165,896,130 people shows a strong positive correlation between the proportion of Jordanians and poverty level among seniors over the age of 75 in the United States with a correlation coefficient (R) of 0.763 and weighted average of 11.6%, a difference of 34.9%.
Seniors Poverty Over the Age of 75 Correlation Summary
| Measurement | West Indian | Jordanian |
| Minimum | 2.6% | 2.4% |
| Maximum | 40.0% | 100.0% |
| Range | 37.4% | 97.6% |
| Mean | 15.7% | 12.5% |
| Median | 14.8% | 10.4% |
| Interquartile 25% (IQ1) | 12.1% | 6.9% |
| Interquartile 75% (IQ3) | 19.7% | 11.3% |
| Interquartile Range (IQR) | 7.6% | 4.4% |
| Standard Deviation (Sample) | 7.6% | 14.6% |
| Standard Deviation (Population) | 7.5% | 14.4% |
Similar Demographics by Seniors Poverty Over the Age of 75
Demographics Similar to West Indians by Seniors Poverty Over the Age of 75
In terms of seniors poverty over the age of 75, the demographic groups most similar to West Indians are Immigrants from Honduras (15.7%, a difference of 0.17%), Immigrants from Latin America (15.6%, a difference of 0.31%), Immigrants from Trinidad and Tobago (15.7%, a difference of 0.35%), Ecuadorian (15.7%, a difference of 0.39%), and Hispanic or Latino (15.8%, a difference of 0.55%).
| Demographics | Rating | Rank | Seniors Poverty Over the Age of 75 |
| U.S. Virgin Islanders | 0.0 /100 | #295 | Tragic 15.4% |
| Yuman | 0.0 /100 | #296 | Tragic 15.4% |
| Hondurans | 0.0 /100 | #297 | Tragic 15.4% |
| Natives/Alaskans | 0.0 /100 | #298 | Tragic 15.5% |
| Spanish American Indians | 0.0 /100 | #299 | Tragic 15.5% |
| Bahamians | 0.0 /100 | #300 | Tragic 15.5% |
| Immigrants | Latin America | 0.0 /100 | #301 | Tragic 15.6% |
| West Indians | 0.0 /100 | #302 | Tragic 15.7% |
| Immigrants | Honduras | 0.0 /100 | #303 | Tragic 15.7% |
| Immigrants | Trinidad and Tobago | 0.0 /100 | #304 | Tragic 15.7% |
| Ecuadorians | 0.0 /100 | #305 | Tragic 15.7% |
| Hispanics or Latinos | 0.0 /100 | #306 | Tragic 15.8% |
| Immigrants | West Indies | 0.0 /100 | #307 | Tragic 15.8% |
| Immigrants | Bangladesh | 0.0 /100 | #308 | Tragic 15.8% |
| Yup'ik | 0.0 /100 | #309 | Tragic 15.8% |
Demographics Similar to Jordanians by Seniors Poverty Over the Age of 75
In terms of seniors poverty over the age of 75, the demographic groups most similar to Jordanians are Guamanian/Chamorro (11.6%, a difference of 0.040%), Syrian (11.6%, a difference of 0.080%), Immigrants from Kuwait (11.6%, a difference of 0.080%), Immigrants from Singapore (11.6%, a difference of 0.13%), and Chickasaw (11.6%, a difference of 0.14%).
| Demographics | Rating | Rank | Seniors Poverty Over the Age of 75 |
| Creek | 92.7 /100 | #94 | Exceptional 11.6% |
| Immigrants | Bosnia and Herzegovina | 92.6 /100 | #95 | Exceptional 11.6% |
| Immigrants | Sweden | 92.6 /100 | #96 | Exceptional 11.6% |
| Romanians | 92.3 /100 | #97 | Exceptional 11.6% |
| Immigrants | Japan | 91.9 /100 | #98 | Exceptional 11.6% |
| Immigrants | Ethiopia | 91.7 /100 | #99 | Exceptional 11.6% |
| Syrians | 91.1 /100 | #100 | Exceptional 11.6% |
| Jordanians | 90.8 /100 | #101 | Exceptional 11.6% |
| Guamanians/Chamorros | 90.6 /100 | #102 | Exceptional 11.6% |
| Immigrants | Kuwait | 90.5 /100 | #103 | Exceptional 11.6% |
| Immigrants | Singapore | 90.3 /100 | #104 | Exceptional 11.6% |
| Chickasaw | 90.2 /100 | #105 | Exceptional 11.6% |
| Russians | 89.9 /100 | #106 | Excellent 11.6% |
| Immigrants | Oceania | 89.4 /100 | #107 | Excellent 11.7% |
| Turks | 89.4 /100 | #108 | Excellent 11.7% |